Published on: 2025-10-07
Updated on: 2026-07-28
Short-term price movements can be affected by unexpected economic data, changes in interest-rate expectations, geopolitical developments, and shifts in market positioning. However, investors can monitor the broader factors that influence gold prices, including real interest rates, the U.S. dollar, central bank demand, inflation expectations, and risk sentiment.
Daily gold direction cannot be forecast reliably but the drivers behind it can be measured.
Five inputs decide most of the movement: real interest rates, the US dollar, central bank buying, ETF flows, and physical demand.
Central banks bought 863 tonnes of gold in 2025, well above the 2010 to 2021 average of 473 tonnes a year according to World Gold Council.
Local rate adds import duty, tax, currency conversion, and making charges to the international price. In India, that stack alone adds close to 18% before any jeweller margin.
The data that moves gold arrives on a published schedule that can be studied and calculated.
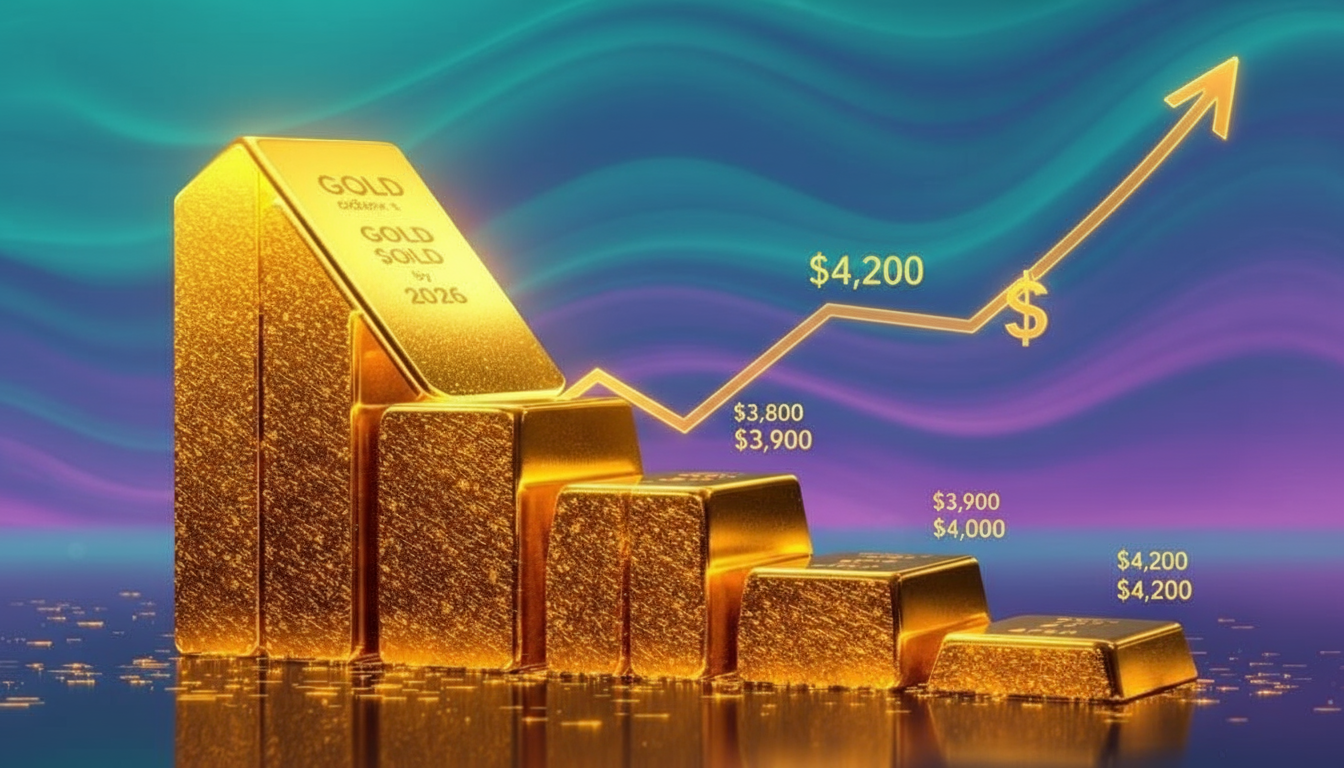
Gold pays no interest and generates no earnings. Its price is therefore set by what people are willing to give up to hold it. Five inputs shape that decision.
The real interest rate is the return on a government bond after expected inflation is removed. When real yields rise, holding an asset that pays nothing becomes more expensive, and gold tends to weaken. When real yields fall, the opposite applies. This has been the most reliable single relationship in the gold market for most of the past two decades, though the World Gold Council notes the link loosened after 2022 as official-sector buying grew.
The number to check is the 10-year US Treasury inflation-protected security yield, published daily by the Federal Reserve Bank of St. Louis as series DFII10. It stood near 2.37% in late July 2026, high by the standard of the past decade. A real yield at that level is a headwind for gold, not a tailwind.
Gold is quoted in dollars. A stronger dollar makes the same ounce more expensive for buyers paying in rupees, dirhams, rand, or rupiah, which usually cools demand. A weaker dollar does the reverse.
The relationship is directional, not mechanical. Through 2024 and 2025, gold and the dollar rose together at times, because central bank purchases were large enough to override the currency effect. Treat the dollar as one input among several rather than a switch.
This is the structural change of the past four years and the reason gold behaved differently from what real-yield models predicted. Central banks have been buying at roughly double their previous pace.
Period |
Central bank net purchases |
|---|---|
2010 to 2021 average |
473 tonnes per year |
2022 |
1,082 tonnes |
2023 |
1,037 tonnes |
2024 |
approximately 1,045 tonnes |
2025 |
863 tonnes |
Q1 2026 |
244 tonnes, up 3% year on year |
Source: World Gold Council, Gold Demand Trends. Poland’s central bank was the largest single buyer in 2025, adding 102 tonnes.
This demand is largely price-insensitive. The People’s Bank of China added 14.93 tonnes in June 2026, its twentieth consecutive month of purchases, taking reserves to 75.44 million troy ounces, or about 2,346 tonnes (People’s Bank of China data published July 7, 2026).
That buying continued through a quarter in which the price fell sharply. Official reserve managers work to multi-year mandates and do not chase the daily chart, which puts a floor under demand that did not exist a decade ago. For the background on this shift, see why central banks keep adding gold to their reserves.
Exchange-traded funds backed by physical gold are the fastest-moving source of investment demand, and their flows are published weekly and monthly by the World Gold Council. Gold ETFs added 801 tonnes across 2025, the strongest year on record in dollar terms. Q1 2026 brought a further 62 tonnes, a seventh straight positive quarter, but far below the 230 tonnes added in Q1 2025.
That slowdown is the useful detail. Flows stayed positive while the price fell, which tells you investors were not selling in bulk. A shift from inflow to sustained outflow would be a genuine change in the picture.
Jewellery, bar, and coin demand set the floor and follow a calendar. Indian buying concentrates around Akshaya Tritiya in April or May, Dhanteras and Diwali in October or November, and the two wedding windows. Chinese New Year lifts first-quarter demand. Q4 is usually the strongest quarter worldwide.
High prices change the shape of that demand rather than removing it. In Q1 2026, global jewellery consumption fell 23% to 299.7 tonnes, the weakest since Q2 2020, while bar and coin demand rose 42% to 473.6 tonnes, the second-highest quarter on record.
India followed the same split: jewellery down 19% to 66.1 tonnes, bar and coin up 34% to 62.3 tonnes, the highest first quarter since 2013, alongside record Indian gold ETF demand of 20 tonnes (World Gold Council, Gold Demand Trends Q1 2026). Buyers did not leave the market. They switched from ornaments to metal.
The international price is quoted in US dollars per troy ounce. Your local rate is quoted in local currency per 10 grams or per tola, and it includes costs the international price does not.
Four things sit between the two numbers.
Unit conversion. One troy ounce is 31.1035 grams.
The exchange rate. A rupee or rand move changes your local rate even when the dollar price is flat.
Import duty and tax. In India, total import duty on gold was raised to 15% in May 2026, made up of 10% basic customs duty and 5% agriculture infrastructure and development cess, with 3% GST charged on top (Central Board of Indirect Taxes and Customs, Notification 16/2026).
Making charges and local premium. Jeweller fabrication costs and city-level premiums are added last, which is why the rate differs between Mumbai, Chennai, and Hyderabad on the same day.
To convert an international price to a landed local price per 10 grams:
(spot price in USD per ounce × local currency per USD) ÷ 31.1035 × 10
Then apply duty and tax. Using India as the worked example, with a spot price of US$4,000 and an illustrative exchange rate of 90 rupees per dollar:
4,000 × 90 = 360,000 rupees per troy ounce
360,000 ÷ 31.1035 × 10 = 115,743 rupees per 10 grams
Apply 15% duty: 133,104
Apply 3% GST: 137,097 rupees per 10 grams for 24 carat, before making charges
For 22 carat, multiply the 24 carat figure by 0.916. Substitute the live spot price and exchange rate to get the current number.
The practical consequence: the gold rate in India can rise on a day when the international price falls, if the rupee weakens by more than the dollar price drops. Two people looking at two correct charts will disagree about whether gold went up. Both are right.
Indicator |
Latest reading |
Source and date |
|---|---|---|
Record LBMA PM benchmark |
US$5,405 per ounce |
LBMA, January 2026 |
Q1 2026 average price |
US$4,872.9 per ounce, a quarterly record |
LBMA, Q1 2026 |
Year-to-date price change |
Around 7% lower |
World Gold Council, to June 26, 2026 |
10-year US real yield |
Approximately 2.37% |
FRED series DFII10, July 2026 |
Fed funds target range |
3.50% to 3.75%, held |
FOMC, June 17, 2026 |
US CPI |
3.5% headline, 2.6% core, year on year |
Bureau of Labor Statistics, released July 14, 2026 |
Central bank purchases |
244 tonnes |
World Gold Council, Q1 2026 |
Mine production |
885 tonnes, a first-quarter record |
World Gold Council, Q1 2026 |
Recycling supply |
366 tonnes, up 5% |
World Gold Council, Q1 2026 |
One projection worth knowing, and worth treating as a projection rather than a fact: the World Bank’s April 2026 Commodity Markets Outlook put the precious metals price index 42% higher across 2026 and 8% lower in 2027, with gold averaging around US$4,700 per ounce for the year.
The same institution had forecast an average near US$3,575 six months earlier. The size of that revision is itself a lesson about forecast precision.
Over long periods, yes. Over the next few days or months, the evidence is weak.
A 2026 study in Economic Analysis and Policy examined gold and inflation across March 1968 to August 2025 and found correlations to be generally insignificant at horizons of roughly 2 to 32 months, turning consistently positive only beyond about 128 months, which is more than ten years. The World Gold Council’s own research reaches a similar conclusion, describing gold as a proven long-run store of purchasing power but a less convincing short-term inflation hedge.
The practical reading: a monthly CPI print rarely moves gold because of inflation itself. It moves gold because of what it implies for interest rate expectations, and therefore for real yields.
Watching a calendar of scheduled releases is more productive than watching daily commentary.
Release |
Publisher |
Frequency |
|---|---|---|
Gold Demand Trends |
World Gold Council |
Quarterly |
ETF flow data |
World Gold Council |
Monthly and weekly |
Official gold reserves |
People’s Bank of China |
Monthly, around the 7th |
Consumer Price Index |
US Bureau of Labor Statistics |
Monthly |
Interest rate decision and projections |
Federal Open Market Committee |
Eight times a year |
10-year real yield |
Federal Reserve Bank of St. Louis |
Daily |
Benchmark prices |
LBMA |
Twice daily |
Gold trades close to around the clock on weekdays. On EBC’s platforms, XAU/USD is available from Monday 01:05 to Friday 23:58 (UTC+2), with a short daily break, as set out in the commodity contract specifications. Prices continue to react while local physical markets are closed, which is one reason morning local rates can gap from the previous evening’s close.
No source can answer this accurately, including this one. Short-term direction depends on real interest rates, the dollar, and flows that change without notice. Gold fell from a record above US$5,400 in January 2026 to below US$4,000 in late June 2026, so a strong recent trend is not evidence of the next move. What can be checked is the direction of the 10-year real yield, the dollar, and the most recent central bank and ETF flow data.
The same limits apply in reverse. As of mid-2026, one input pointed lower for gold, with the 10-year US real yield near 2.37%, and one pointed higher, with central banks still buying at 244 tonnes in Q1 2026. Those two forces have pulled in opposite directions since 2022.
This page does not direct financial decisions. The factors that shape the answer are personal rather than market-wide: the currency you spend, whether the holding is jewellery or bullion, the making charges already paid, and the resale spread your local dealer applies. On the market side, the checkable facts are the current international price, your local premium over it, and the duty and tax structure described above.
That level requires the product of the dollar price and the rupee exchange rate to reach roughly 525,000, using the 15% duty and 3% GST structure in place from May 2026. At 90 rupees per dollar, that implies an international price near US$5,835 per ounce, above the January 2026 record. At 100 rupees per dollar, around US$5,250 would be enough. The rupee therefore carries as much of the burden as the gold price does.
Local rates add transport, dealer premium, state-level factors, and jeweller making charges to the same landed price. Those components vary by city and by shop, so two quotes on the same day can differ by a few per cent.
Physical demand rises. The price does not automatically follow, because Indian festival buying is a fraction of a market set by global investment and official-sector flows. Seasonality is more visible in local premiums and making charges than in the international price.
Separate the two numbers. The international price answers a global question about real interest rates, the dollar, and official-sector demand. Your local rate answers that question plus a currency question plus a tax question plus a jeweller’s margin. Confusing them is why people conclude gold “went up” on a day it fell.
Track the international price against the real yield and the central bank data, and track your local premium against it separately. Those two habits will tell you more than any number of daily direction calls. If you want the longer horizon rather than the next few days, the five-year gold outlook for India covers the structural drivers, while how XAU/USD is quoted and traded and how gold CFDs work explain the mechanics of the international market. For the wider asset context, start at the precious metals hub, and for the background to the January 2026 peak, see the record high and what preceded it.
Disclaimer: This material is for general information purposes only and is not intended as (and should not be considered to be) financial, investment or other advice on which reliance should be placed. No opinion given in the material constitutes a recommendation by EBC or the author that any particular investment, security, transaction or investment strategy is suitable for any specific person.