Published on: 2025-08-21
Updated on: 2025-08-21
If you have ever studied stock market history or technical analysis, chances are you've come across the Dow Theory and its six timeless tenets. In simple words, Dow Theory explains how markets move in phases of trends, how averages confirm each other, and how volume plays a role in validating price action.
Even though it originated more than a century ago, its relevance remains strong today, especially for traders in growing economies like India, where benchmarks such as the Nifty 50, Sensex, USD/INR, and Gold dominate trading activity.
In this article, we will break down the meaning of Dow Theory, its historical roots, the six key tenets, and practical ways traders can use it today.

Dow Theory is one of the earliest and most respected approaches to technical analysis. At its core, it argues that the market discounts everything: all available information, expectations, and investor emotions are reflected in stock prices.
Prices move in trends, and these trends can be analysed, confirmed, and traded effectively.
Dow divided market trends into three categories:
Primary trends (lasting for years, like bull or bear markets)
Secondary trends (lasting for weeks or months, corrections within the bigger trend)
Minor trends (daily fluctuations, often just market noise)
For Indian traders: If the Nifty 50 experiences a two-year continuous increase, that constitutes a primary trend. A one-month dip is a secondary correction. A daily move of 0.5% up or down is just a minor fluctuation.
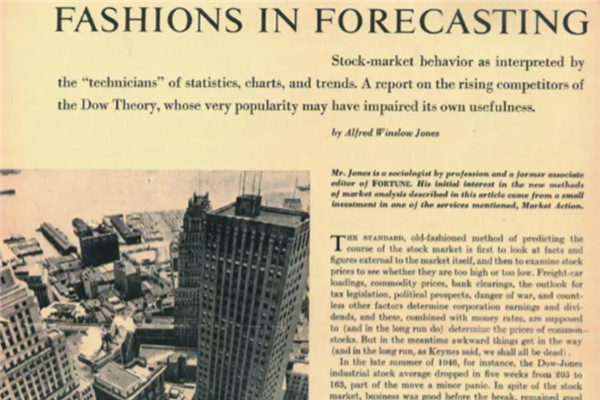
The Dow Theory originates from Charles Dow's editorials in The Wall Street Journal during the late 19th and early 20th centuries. Although Dow himself never published a formal book on the theory, his writings laid the groundwork for technical market analysis.
After his death, William Hamilton and Robert Rhea, along with other analysts, refined his work into the Dow Theory we know today. Despite being over 100 years old, this framework continues to influence modern trading strategies and technical indicators.

1. The Market Discounts Everything
According to Dow, stock prices reflect all available information. It includes earnings reports, interest rate changes, inflation expectations, global conflicts, and even investor psychology.
For example, when the Reserve Bank of India suggests a rise in interest rates, the Nifty or Bank Nifty usually reacts before the formal announcement. It occurs because the market anticipates expectations beforehand,
Why It Matters for Traders: By the time you react to news, the market may have already priced it in.
2. The Market Has Three Types of Trends
Dow categorised market movements into three distinct trends:
Primary Trend (Long-Term): This can last for years and represents a complete bull or bear market.
Secondary Trend (Medium-Term): These are corrections or rallies within the primary trend, usually lasting weeks to months.
Minor Trend (Short-Term): Day-to-day fluctuations that often last only a few days.
Example: During a bull market (primary trend), the market may still experience short-term dips (secondary downtrends), which should not be mistaken for the end of the bull market.
3. Primary Trends Have Three Phases
Dow believed that every major bull or bear market unfolds in three stages:
Accumulation Phase: Smart money (institutional investors) begins to buy or sell quietly before the general public notices.
Public Participation Phase: The majority of traders recognise the trend, leading to strong momentum and rising prices.
Excess or Distribution Phase: The market becomes overly optimistic or pessimistic, and the smart money exits, preparing for a reversal.
Example in India: IPO booms of Zomato or Nykaa saw classic public participation, followed by a phase of excessive enthusiasm.
Why It Matters: Recognising which phase the market is in helps traders avoid buying at the peak or selling at the bottom.
4. The Averages Must Confirm Each Other
In Dow's time, there were two main stock market averages: the Dow Jones Industrial Average (DJIA) and the Dow Jones Transportation Average (DJTA). Dow argued that both averages must move in the same direction for a trend to be confirmed.
For example, if industrial stocks rise but transportation stocks fall, it may signal weakness because goods are not shipping as expected.
Modern Application: Today, traders apply this across multiple indices. For example, Nifty and Bank Nifty should confirm each other for a trend to be reliable.
5. Volume Confirms the Trend
Dow believed that trading volume should rise in the direction of the prevailing trend.
In a bull market, rising prices should follow increasing volume.
In a bear market, declining prices should follow higher selling volume.
If prices move on low volume, the move may be temporary and not a complete signal.
In India, during bull markets, traders can observe increased trading volumes in major stocks such as HDFC Bank and TCS. When prices rise but volumes decline, the move may lack conviction.
Why It Matters: Volume acts as a secondary indicator, confirming the strength of a price move.
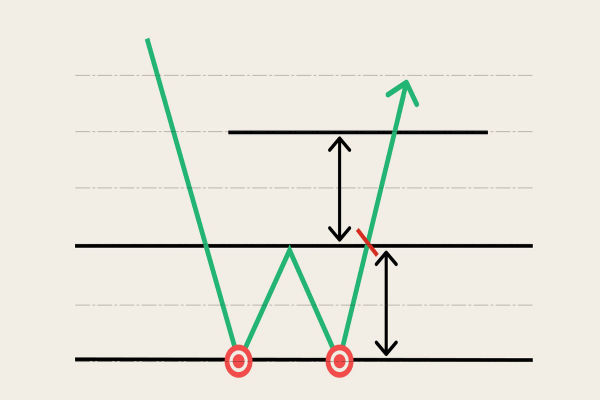
6. A Trend Remains in Effect Until It Gives a Clear Reversal Signal
Perhaps the most practical of all, this tenet states that trends are more likely to continue than to reverse. Traders should assume that the current trend is intact until clear evidence suggests otherwise.
For example, even when the Nifty falls 5% in a correction, it doesn't mean the bull market is over. A confirmed reversal happens when lower highs and lower lows form consistently, supported by strong volume.
Trading Takeaway: Don't fight the trend. Stay with it until the market proves you wrong.
Although markets are more complex now, Dow Theory remains a valuable tool for:
Identifying long-term trends in stocks, forex, and commodities.
Confirming trend reversals before making investment decisions.
Avoiding emotional trading by sticking to objective rules.
For example, forex traders might use Dow Theory to identify major trends in EUR/USD or USD/JPY. As for stock traders, they could utilise it to confirm if the overall market is beginning a new bull cycle.
In India's rapidly expanding markets, where FII investments, RBI actions, and global commodity prices have a significant impact, Dow Theory remains a cornerstone for technical analysis.

1. Dow Theory and Nifty 50
Nifty's long bull run after the COVID-19 crash (2020–2022) is a perfect example of a primary uptrend. Corrections during 2021 were secondary trends, but the broader bullish structure stayed intact.
2. Dow Theory in Bank Nifty
The Bank Nifty typically leads the Nifty index because the banking and financial sectors play a crucial role in driving the economy. If both indices rally together, it confirms bullish momentum.
3. Dow Theory in USD/INR
Currency traders can also apply the Dow Theory. For instance, USD/INR's steady rise in 2022 (from 74 to 83) showed a primary uptrend, driven by rising oil prices and FII outflows.
While Dow Theory is powerful, it is not flawless.
Lagging Nature: Due to its emphasis on confirmation, traders might join a trend later than they prefer.
Subjectivity: Deciding when a trend has ended can be subjective.
Not Designed for Intraday Trading: Dow Theory works best for medium to long-term analysis, rather than short-term scalping.
Tip: Combine Dow Theory with modern tools such as moving averages, RSI, or Fibonacci retracements for sharper insights.
1. What Is Dow Theory in Simple Terms?
Dow Theory is a market analysis method that explains how stock prices move in trends and how traders can identify the beginning and end of these trends using price action, averages, and volume.
2. Who Developed Dow Theory and Why Is It Important?
Dow Theory was developed by Charles Dow, co-founder of Dow Jones & Company. It is crucial as it establishes the basis for contemporary technical analysis and assists traders in grasping market psychology and trend dynamics.
3. Is Dow Theory Still Relevant in 2025?
Yes. Its timeless focus on trend analysis and market psychology applies as much to the Nifty and USD/INR today as to the Dow Jones a century ago.
In conclusion, Dow Theory remains one of the most powerful frameworks for analysing the market. Its six timeless principles apply as strongly to the Nifty, Sensex, and Indian currency markets as they did to the Dow Jones a century ago.
For Indian traders, learning Dow Theory offers a solid foundation in technical analysis, helping them avoid emotional decisions and align with the real market trend. Whether you're trading Nifty, commodities, or forex, Dow Theory sharpens your edge in navigating markets.
Disclaimer: This material is for general information purposes only and is not intended as (and should not be considered to be) financial, investment or other advice on which reliance should be placed. No opinion given in the material constitutes a recommendation by EBC or the author that any particular investment, security, transaction or investment strategy is suitable for any specific person.