Published on: 2026-04-03
Updated on: 2026-04-03
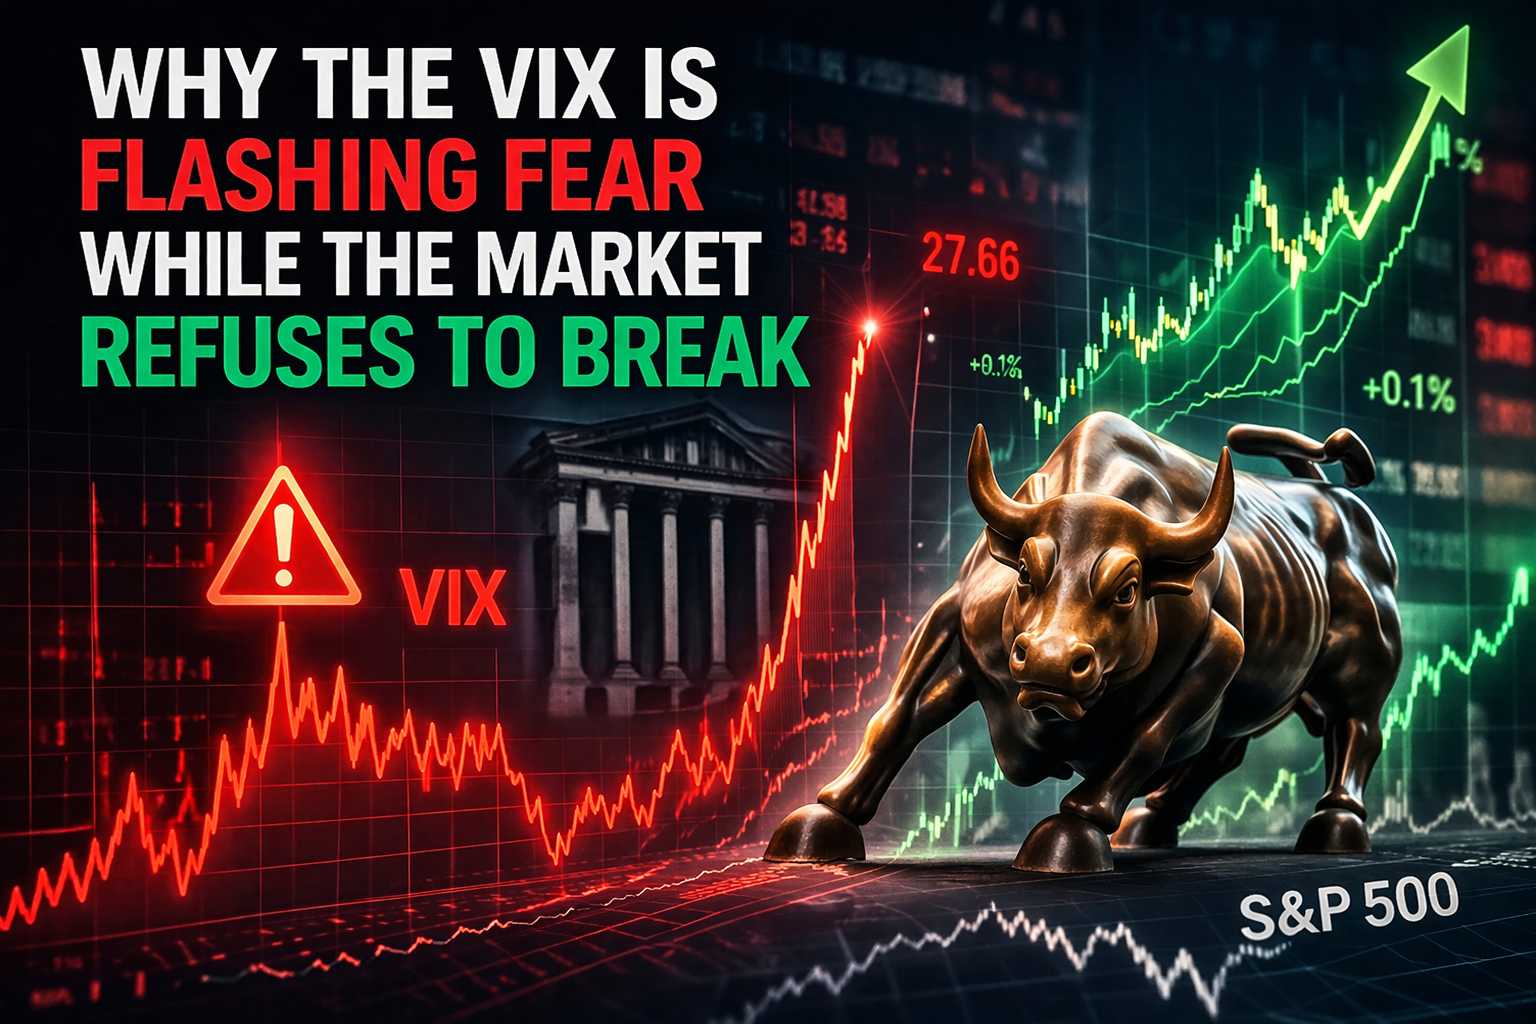
The VIX closed at 24.54 on April 1 and rose to just over 27 during the April 2 session. A reading at that level is not a panic signal on its own, but it is meaningfully above the long-run average of around 19 and implies that the options market is pricing in daily S&P 500 swings of roughly 1.7% for the next thirty days.
The cash market, on the same day, told a different story. The S&P 500 ended April 2 up 0.1%. The Nasdaq added 0.2%. The Russell 2000 closed up 0.7%. And by the end of the week, the S&P 500 and Nasdaq had gained 3.4% and 4.4% respectively.
That gap between what the fear gauge is pricing and what prices are actually doing is the most interesting question in the market right now.
A high VIX does not automatically mean stocks are about to unravel. It means options traders are paying more for near-term protection because they expect larger swings. In a market shaped by geopolitical risk, elevated oil prices, and shifting rate expectations, that is a rational response.
That is why the current setup matters. Volatility expectations have risen sharply, but the cash market has not confirmed a broad breakdown. Instead, stocks have absorbed repeated shocks and still finished the shortened week higher. That is not what panic usually looks like.
 The VIX divergence in context:
| Indicator | Reading | Signal |
|---|---|---|
| VIX intraday high, April 2 | 27.66 | Options pricing elevated stress |
| VIX implied daily S&P move | ~1.7% | Implied volatility remains elevated |
| S&P 500 close, April 2 | +0.1% | Cash market absorbing news |
| Nasdaq close, April 2 | +0.2% | Growth stocks holding |
| Russell 2000 close, April 2 | +0.7% | Small caps showing relative strength |
| S&P 500, week ending April 2 | +3.4% | Weekly gain despite high VIX |
| Nasdaq, week ending April 2 | +4.4% | Strong weekly rebound despite elevated VIX |
| S&P 500 stocks above 50-day MA | 28.62% | Weak breadth, but not capitulation |
| S&P 500 stocks above 200-day MA | 48.31% | Long-term breadth remains mixed |
The major indexes were under pressure early in the April session, but the market’s internals improved as the day progressed.
Advancing stocks outnumbered decliners on both the NYSE and the Nasdaq, and advancing volume led losing volume on both exchanges. Small caps also reversed from an early drop to finish the day positive.
That is a meaningful signal. When breadth improves during a volatile session, it suggests investors are not exiting the market indiscriminately. They are still rotating, still selecting, and still willing to buy weakness.
This is not proof of safety, but it is evidence of underlying resilience. This is an inference based on breadth and volume data collected during the session.
The simplest explanation is that the options market and the stock market are solving different problems. The options market is focused on the risk of sharp short-term moves.
The cash market is still weighing whether the economy, earnings, and liquidity backdrop are strong enough to prevent those swings from becoming more serious.
There is also a mechanical element. Recent derivatives data showed a large imbalance between call and put delta tied to the S&P 500, a setup that can force hedging flows to amplify both rallies and selloffs.
That helps explain why the tape can feel unstable even when the closing moves look modest.
The Russell 2000 matters more than usual in this environment. Small caps tend to offer a cleaner read on domestic risk appetite than a market dominated by mega-cap technology.
If investors were truly bracing for an immediate economic break, smaller companies would usually struggle more visibly. Instead, the Russell 2000 rose 0.7% on April 2 and remained up 1.9% year to date, even as the S&P 500 and Nasdaq were still negative for 2026.

That does not mean fear is misplaced. It means fear has not yet been fully liquidated. Right now, the market appears willing to hedge aggressively while still maintaining exposure to risk assets underneath the surface.
That is a different message from the one implied by the VIX alone. This is an inference from the relative performance of small caps and the level of implied volatility.
This gap between elevated volatility and market resilience will not stay unresolved forever. The next likely test is earnings season.
If companies hold margins and keep guidance intact despite higher oil and a more fragile geopolitical backdrop, the cash market may continue to withstand the fear signal.
If guidance weakens, stocks may finally begin to reflect what options traders are already paying for.
That is what makes this a better market story than a simple index recap. The most useful question is not whether the VIX is high. It is whether the market’s internals are still strong enough to absorb that fear without turning it into a sustained decline. For now, they appear to be.
The next few weeks will decide whether the VIX’s fear signal or the cash market’s resilience is the better guide.
Forward guidance matters most: Q1 results will matter less for backwards-looking beats than for what companies say about Q2 and the second half. Watch airlines, industrials, logistics, and consumer staples first. Those sectors will show whether higher oil and input costs are being absorbed or passed on.
The S&P 500’s 200-day moving average remains key: The index broke below it on March 19 and has yet to convincingly reclaim it. A sustained move back above that level, with stronger breadth, would improve the technical picture. A failure there would keep downside support near 6,300 in focus.
The VIX term structure is another signal: If near-term contracts ease faster than longer-dated ones, traders are pricing resolution. A flat or inverted curve would suggest fear is becoming more entrenched.
Oil and the Strait of Hormuz still matter most: A credible ceasefire or confirmed reopening would ease inflation fears, improve rate-cut expectations, and likely narrow the gap between elevated volatility and resilient equities.
Credit spreads could be the tie-breaker: High-yield spreads widened sharply in late March. If they keep widening while stocks hold up, credit is warning that equities may be too calm. If they stabilise, the market’s resilience looks more credible.
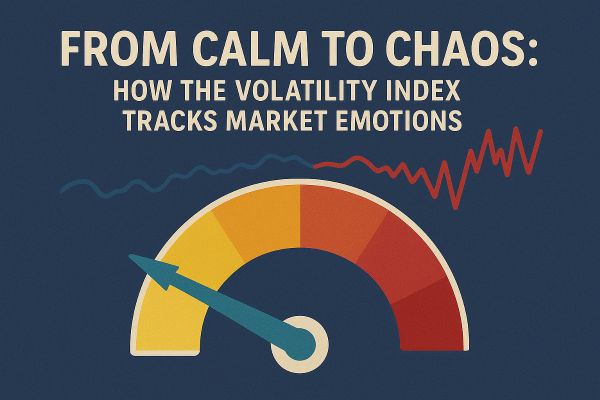
The VIX measures expected 30-day volatility in the S&P 500 based on options prices. It is a gauge of implied volatility, not a direct forecast of market direction.
Because the VIX reflects the cost of protection. Traders can bid up options even when the cash market is stable or recovering.
Breadth shows whether buying or selling is broad. On April 2, advancing stocks outnumbered decliners on both main exchanges, which suggested firmer underlying demand than the headline volatility implied.
Small caps are often a better read on domestic risk appetite. The Russell 2000 outperformed on April 2 and remained positive for the year, which supports the case that investors are not fully pricing a breakdown in growth.
A deterioration in earnings, margins, or forward guidance would make the options market’s warning more relevant to the cash market.
The VIX is doing exactly what it should in a market shaped by war risk, elevated oil prices, and headline-driven swings. It is pricing fear. But the broader market is giving a more nuanced message.
Breadth improved, small caps held up, and the major indexes still finished the week with gains.
That is why this divergence matters. The VIX is flashing stress, but the market still refuses to break broadly and convincingly. Until earnings or macro data prove otherwise, that gap remains one of the clearest signals in the market right now.
Disclaimer: This material is for general information purposes only and is not intended as financial, investment, or other advice on which reliance should be placed. No opinion given in the material constitutes a recommendation by EBC or the author that any particular investment, security, transaction, or investment strategy is suitable for any specific person.