Published on: 2026-03-11
The VIX, or Cboe Volatility Index, is the main benchmark for expected 30-day volatility in the S&P 500. It shows how much volatility investors expect in the U.S. stock market over the near term and is widely used as a measure of market risk.

When the VIX rises, it usually signals that investors expect larger market swings. When it falls, it suggests a calmer market environment.
The VIX, or Cboe Volatility Index, is a benchmark that represents the market’s expected volatility in the S&P 500 over the subsequent 30 days.
The VIX measures implied volatility, reflecting the premium investors are willing to pay for protection against anticipated market fluctuations. It is derived from S&P 500 option prices rather than historical market movements.
Although the VIX is frequently referred to as the market’s “fear gauge,” this characterization is only partially accurate. While fear can elevate the VIX during market sell-offs, it is more accurately described as the real-time price of near-term S&P 500 risk.
The VIX is calculated using S&P 500 index options rather than stock prices alone. Option prices are utilized because they reflect the premiums investors are willing to pay for protection against future market volatility.
To build the VIX, Cboe uses a wide range of out-of-the-money call and put options on the S&P 500. The calculation considers two option maturities: the near-term and the next-term contracts. These are combined to produce a single measure of expected volatility over the subsequent 30 days.
In simple terms, the process works like this:
Gather option prices across many strike prices
Use those prices to estimate expected market variance
Blend the two option maturities into a 30-day measure
Convert variance into volatility
Express the result as an index number
A simplified formula of variance is shown below:

In that formula:
T = time to expiration
K = option strike price
ΔK = spacing between strike prices
R = risk-free interest rate
Q(K) = midpoint of the option price at strike K
F = forward level of the S&P 500
K₀ = first strike below the forward index level
The formula above only produces expected variance. To get the VIX, Cboe then converts that into a 30-day annualized volatility figure with the below formula:

For example, a VIX value of 20 indicates that the market is pricing approximately 20% annualized volatility over the next 30 days. This does not imply that the S&P 500 will move 20% within the next month.
The utility of the VIX lies in its reliance on a broad set of S&P 500 options rather than a single option or strike price. This approach provides a more comprehensive perspective on how the market is pricing near-term risk.
A volatility index number shows how much volatility the market expects over the next 30 days. But it is shown as an annualized figure.
That means a VIX reading of 25 does not mean the S&P 500 will move 25% in the next month. It means the market is pricing in volatility at a 25% annual rate.
For clarity, a VIX value of 25 suggests the S&P 500 could move approximately 7.2% in either direction over the next 30 days. Similarly, a VIX of 24.93 implies a 7.1% move, while a VIX of 29.49 implies an 8.5% move.
The essential point is that the VIX measures the expected magnitude of market movements, not their direction. It does not indicate whether stocks will rise or fall, but rather reflects the anticipated level of market volatility.
| VIX signal | What it tells you | What it does not tell you |
|---|---|---|
| VIX is rising | The options market is pricing more 30-day S&P 500 volatility | That stocks must crash tomorrow |
| VIX is falling | Hedging costs are easing | That risk has disappeared |
| Near-term volatility is much higher than longer-term volatility | Risk is concentrated in the near term | The exact outcome or timing of the event |
| Spot VIX is elevated | Investors are paying more than usual for protection | That a recession or bear market is guaranteed |
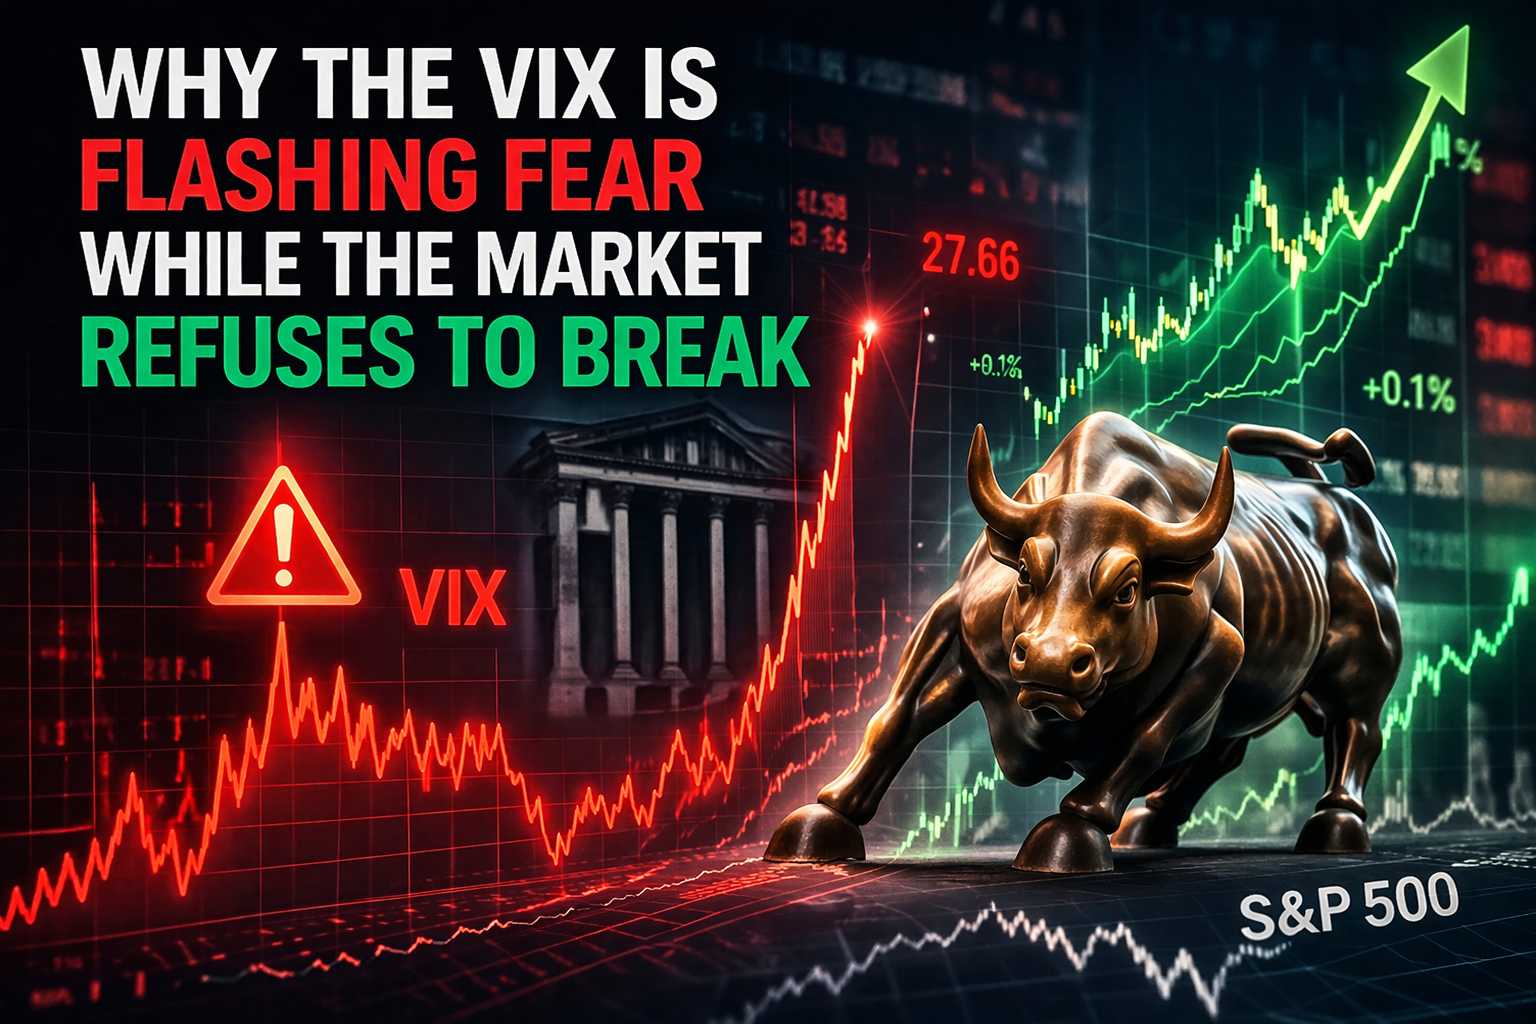
One effective way to understand the VIX is to examine its recent behavior. In early March 2026, the VIX increased sharply, signaling that investors were paying higher premiums for short-term protection amid intensifying market uncertainty.
| Date | VIX close | What it suggests |
|---|---|---|
| March 6, 2026 | 29.49 | High market uncertainty |
| March 9, 2026 | 25.50 | Volatility eased, but stayed elevated |
| March 10, 2026 | 24.93 | Risk remained above calm-market levels |
These readings are higher than what investors typically see in a steady market, suggesting traders still expect larger-than-usual moves in the S&P 500 over the next 30 days.
So, a VIX in the mid-20s does not mean a crash is certain. It means investors expect the market to stay more unstable than usual in the near term.
VIX and the S&P 500 usually move in opposite directions. Cboe notes that the inverse relationship is well established, and in practice that happens because stock sell-offs often trigger heavier demand for downside hedges.
When investors rush to buy index puts, implied volatility rises, and VIX rises with it. This can happen even if the market later recovers part of the day’s losses, because the insurance premium has already repriced.
This characteristic makes the VIX particularly valuable during periods of rapid, headline-driven market activity. For example, on March 3, U.S. stocks experienced a sharp intraday decline due to escalating geopolitical tensions, but ultimately closed well above the session lows.
VIX does not tell you market direction. It tells you the expected magnitude of S&P 500 movement over the next 30 days. A high VIX can appear in falling markets, but it can also remain elevated during violent rebounds if the range of outcomes is still wide.

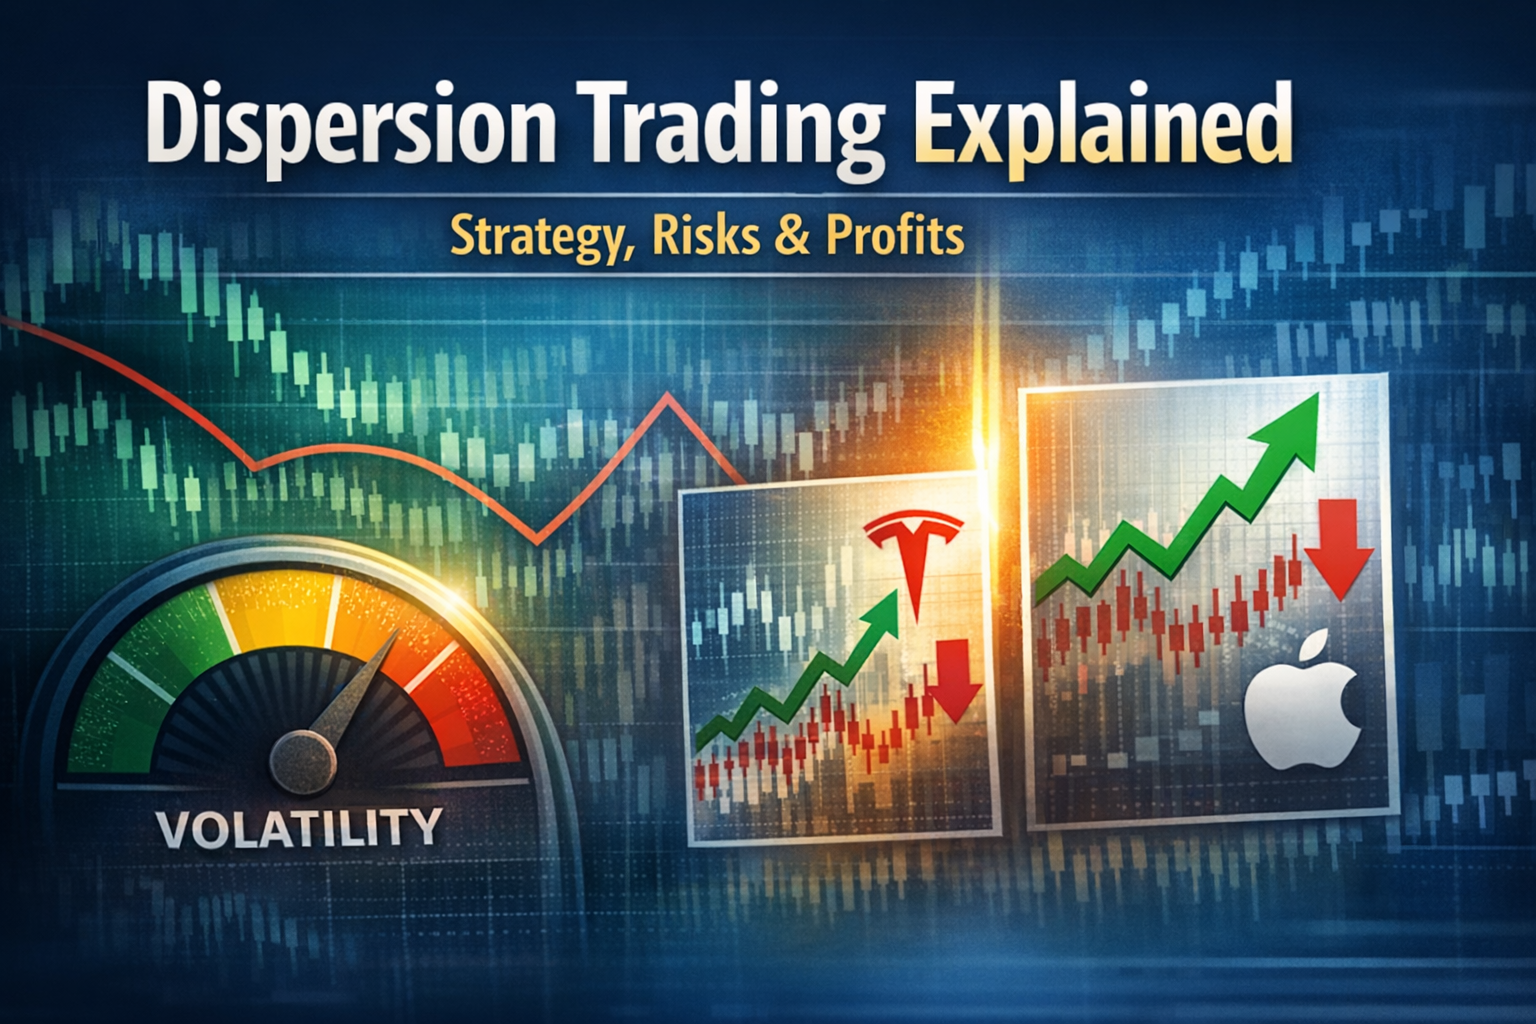
Therefore, the VIX is more appropriately interpreted as a signal of market dispersion and hedging activity, rather than as a purely bearish indicator.
The VIX Index itself is not directly investable. According to Cboe, exposure to volatility is achieved through VIX futures, VIX options, and related products, all of which track forward volatility rather than the spot index.
Many investors mistakenly believe they are purchasing the VIX itself, when in reality they are acquiring instruments linked to VIX futures, which may behave differently from the spot index.
Treating VIX as a directional forecast: It prices expected volatility, not whether the S&P 500 will be up or down.
Ignoring the Time Horizon: VIX is a 30-day measure. It is not built to tell you tomorrow’s move.
Watching Spot VIX Alone: The curve across 9-day, 30-day, and longer horizons often tells a fuller story than spot alone.
Assuming VIX Products Equal Spot VIX: Futures-based exposure is not the same as owning the index, because the index itself is not directly tradable.
VIX shows how much volatility investors expect in the S&P 500 over the next 30 days. It measures the expected size of market moves, not whether stocks will go up or down.
A VIX reading of 20 means the options market is pricing about 20% annualized volatility for the S&P 500 over the next 30 days. It does not mean the market will move 20% this month.
There is no fixed normal level, but around 20 is often treated as a long-run average. Lower readings usually signal calmer markets. Higher readings usually point to greater uncertainty.
A high VIX usually means investors expect larger market swings. There is no exact cutoff, but readings above normal levels often reflect rising uncertainty or market stress.
When stocks drop, investors often buy more downside protection through put options. That pushes implied volatility higher, and the VIX usually rises with it.
Not directly. The VIX is an index, not a stock or fund. Investors usually access it through VIX futures, VIX options, or products linked to those contracts.
Not exactly. VIX measures expected future volatility based on option prices, while historical volatility measures how much the market has already moved.
The VIX shows how much volatility investors expect in the S&P 500 over the next 30 days. It is best used as a measure of market risk, not as a prediction of where stocks will go next.
Disclaimer: This material is for general information purposes only and is not intended as (and should not be considered to be) financial, investment or other advice on which reliance should be placed. No opinion given in the material constitutes a recommendation by EBC or the author that any particular investment, security, transaction or investment strategy is suitable for any specific person.