Published on: 2026-01-26
Updated on: 2026-01-26
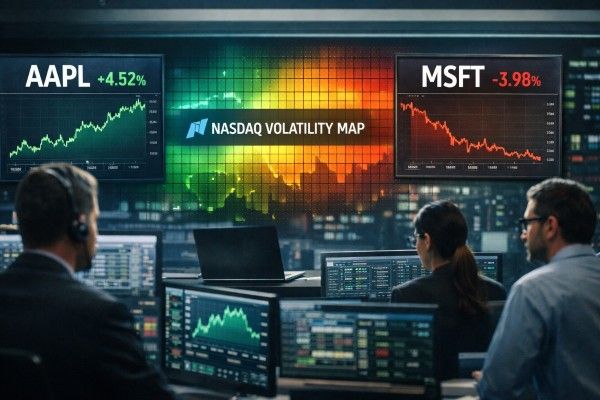
The Nasdaq Volatility Map is flashing a familiar signal as January earnings season reaches its highest-pressure stretch: two companies are large enough to move the index by arithmetic, liquid enough to move it by positioning, and systemically important enough to move it by narrative.

Apple and Microsoft do not simply report results. Their earnings reset the pricing of growth, margins, and capital intensity across the Nasdaq complex, often within minutes of the release.
That influence is unusually concentrated this week. The Nasdaq-100 closed at 25,605.47 on January 23, 2026, while the Nasdaq-100 volatility benchmark (VXN) ended the same day at 20.37, a level consistent with markets pricing a meaningful but not panicked range for near-term moves.
The point is not whether volatility is high or low in absolute terms. The point is where it sits on the map: the index is calm enough to be complacent, yet its largest earnings catalysts arrive back-to-back.
Apple plus Microsoft are the Nasdaq's main "earnings lever."
Options markets are pricing meaningful single-stock gaps.
Wednesday is the volatility fulcrum.
Expect second-order moves in semiconductors and cloud.
Volatility has a plausible "downshift" path after the events clear.
| Company | Nasdaq-100 weight | Earnings timing | Options-implied weekly move | “Index move at risk” (weight × move) |
|---|---|---|---|---|
| Apple (AAPL) | 10.87% | Jan 29 (after close) | 4.46% | ~0.48% |
| Microsoft (MSFT) | 10.32% | Jan 28 (after close) | 5.41% | ~0.56% |
| Meta (META) | 4.95% | Jan 28 (after close) | 6.71% | ~0.33% |
| Tesla (TSLA) | 4.45% | Jan 28 (after close) | 6.27% | ~0.28% |
| ASML (ASML) | 1.61% | Jan 28 | 6.91% | ~0.11% |
| Texas Instruments (TXN) | 0.52% | Jan 27 (after close) | 6.80% | ~0.04% |
For index mechanics, the first-order impact is straightforward:
Nasdaq-100 move attributable to a stock ≈ (index weight) × (stock move).
Using current Nasdaq-100 weights and the options-implied “expected move” into earnings, it is possible to build a practical volatility map: how much index movement is “at risk” from a handful of earnings prints.
In aggregate, those six names alone imply roughly 1.8% of Nasdaq-100 movement “at risk” across the week, before accounting for correlation, sympathy moves, or factor rotations. The key point is that Apple and Microsoft contribute more than half of that by themselves.

The Nasdaq-100 volatility index (VXN) has recently printed around 20. In annualized terms, that corresponds to roughly 1.3% "typical" daily movement for the index (a statistical expectation, not a forecast).
Against that backdrop, a week where multiple top-10 constituents are pricing 4% to 7% single-stock moves is structurally prone to bigger index gaps, especially overnight.
This matters because a large portion of Nasdaq exposure is held through index vehicles (Nasdaq-100 futures, QQQ, and index options).
When earnings force repricing after the cash close, the next day’s open often becomes the true "clearing price" for index risk. In that environment, intraday liquidity can look calm while overnight risk stays high.
Apple reports January 29 after the close.
Apple’s Nasdaq influence is not just its weight (about 11%). It is also its role as a barometer for consumer tech demand, component supply chains, and margin discipline across the hardware complex.
Three Apple-specific channels tend to matter most for Nasdaq-wide pricing:
Services margin versus hardware gross margin. Apple’s earnings often turn into a debate about mix: how much profit is being generated by recurring Services versus device cycles. When Services is strong, the market assigns a higher quality multiple and lifts other “platform” names.
China sensitivity and pricing power. Guidance that signals stable demand and pricing discipline tends to compress perceived tail risk for global consumer tech. When uncertainty rises, Nasdaq often trades like a high-beta macro proxy.
Capital return as volatility dampener. Apple’s buyback capacity acts as a volatility suppressant in drawdowns. Any shift in capital return tone can change how investors model downside convexity.
Mechanically, the options-implied move into Apple’s report is about 4.46%, which maps to roughly 0.48% of Nasdaq-100 movement by weight alone. That is the “base” contribution. The true index impact is usually larger when Apple’s guidance re-rates semiconductors and mega-cap peers.
Microsoft reports January 28 after the close.
Microsoft’s weight is similar to Apple’s, but its earnings have a distinct Nasdaq transmission mechanism: cloud growth plus AI monetisation plus operating leverage.
The market’s Microsoft checklist is typically tight:
Azure growth and bookings: Microsoft is one of the cleanest demand thermometers for enterprise tech. When cloud growth surprises, the entire software cohort reprices quickly.
AI monetisation pace: Investors increasingly model Microsoft like a platform toll collector for AI workloads. Monetisation clarity matters as much as cost.
Margins under heavy capex: If AI infrastructure spending rises faster than gross profit, equity duration lengthens, and the stock’s sensitivity to rates increases.
Options markets are pricing roughly a 5.41% weekly move into the print, implying about 0.56% Nasdaq-100 movement from Microsoft alone. In practice, Microsoft often drives broader factor moves that can pull the index further, especially through semiconductors and large-cap software.
Meta reports January 28 after the close.
With about 4.95% Nasdaq-100 weight and a 6.71% implied move, Meta is a meaningful index volatility contributor.
Meta’s results often pivot on two levers: ad pricing power and expense discipline. In the current cycle, the market is also watching how AI-related investment translates into engagement and monetisation without destabilising margins.
Tesla reports January 28, with its investor webcast scheduled that evening.
Tesla’s Nasdaq weight is smaller than the software giants, but it carries outsized sentiment beta. With a 6.27% implied move and 4.45% index weight, Tesla can add roughly 0.28% of first-order Nasdaq movement.
The stock’s reaction often becomes a risk appetite signal for high-multiple growth more broadly.
ASML reports January 28.
Even at 1.61% Nasdaq-100 weight, an implied move near 6.91% gives it real sector-level influence.
ASML commentary frequently reverberates through the semiconductor equipment chain and, by extension, the AI infrastructure narrative that underpins the index’s largest weights.
Texas Instruments reports January 27, with its earnings call scheduled that afternoon.
Its Nasdaq-100 weight is modest, but the options market is pricing a 6.80% move.
Because Texas Instruments is tied to broad industrial and automotive demand, its guidance can influence how investors think about cyclical semiconductor exposure, which can matter for Nasdaq breadth.
A volatility map built from weights and implied moves captures the mechanical impact, but Nasdaq’s real behaviour is driven by feedback loops:
Correlation clustering: If Microsoft and Meta both surprise in the same direction, software and internet peers often gap with them. Index moves then become a correlation event, not a single-stock event.
AI capex repricing: Microsoft and ASML together form a powerful read-through on AI capacity buildout. Stronger capex signals can lift AI beneficiaries, but can also pressure margins in the near term, creating cross-currents.
Dealer hedging and index options: Heavy index option positioning can dampen intraday swings when markets are inside expected ranges, yet amplify moves when earnings gaps force dealers to chase hedges at the open.
Passive flow mechanics: When the top weights gap, passive Nasdaq vehicles must rebalance in dollar terms. That flow can mechanically reinforce the direction of the first move.
This is why the earnings week should be treated as a sequence of volatility nodes rather than isolated company events.
A Nasdaq volatility map ranks upcoming catalysts by their potential to move the Nasdaq-100, combining index weight and the options-implied expected move. It highlights where index gap risk is concentrated across specific dates.
They are two of the largest Nasdaq-100 constituents by weight. A single-digit percentage move in either can translate into roughly half a percent index movement on mechanics alone, with additional spillovers into correlated mega-cap peers.
It reflects the market’s consensus pricing for a stock’s expected trading range into an event, derived from option premiums. It is not a forecast of direction, and the realised move can be larger or smaller.
Tech valuations are sensitive to discount rates. If Fed messaging shifts rate expectations while mega-cap guidance simultaneously changes growth expectations, Nasdaq can reprice quickly because both valuation levers move at once.
January 28 stands out: it includes the Fed decision and multiple mega-cap tech earnings after the close, creating both macro and single-stock gap risk in one session.
No. VXN measures implied volatility, not direction. Elevated VXN typically signals uncertainty and wider expected ranges, and it can fall after events even if prices rise.
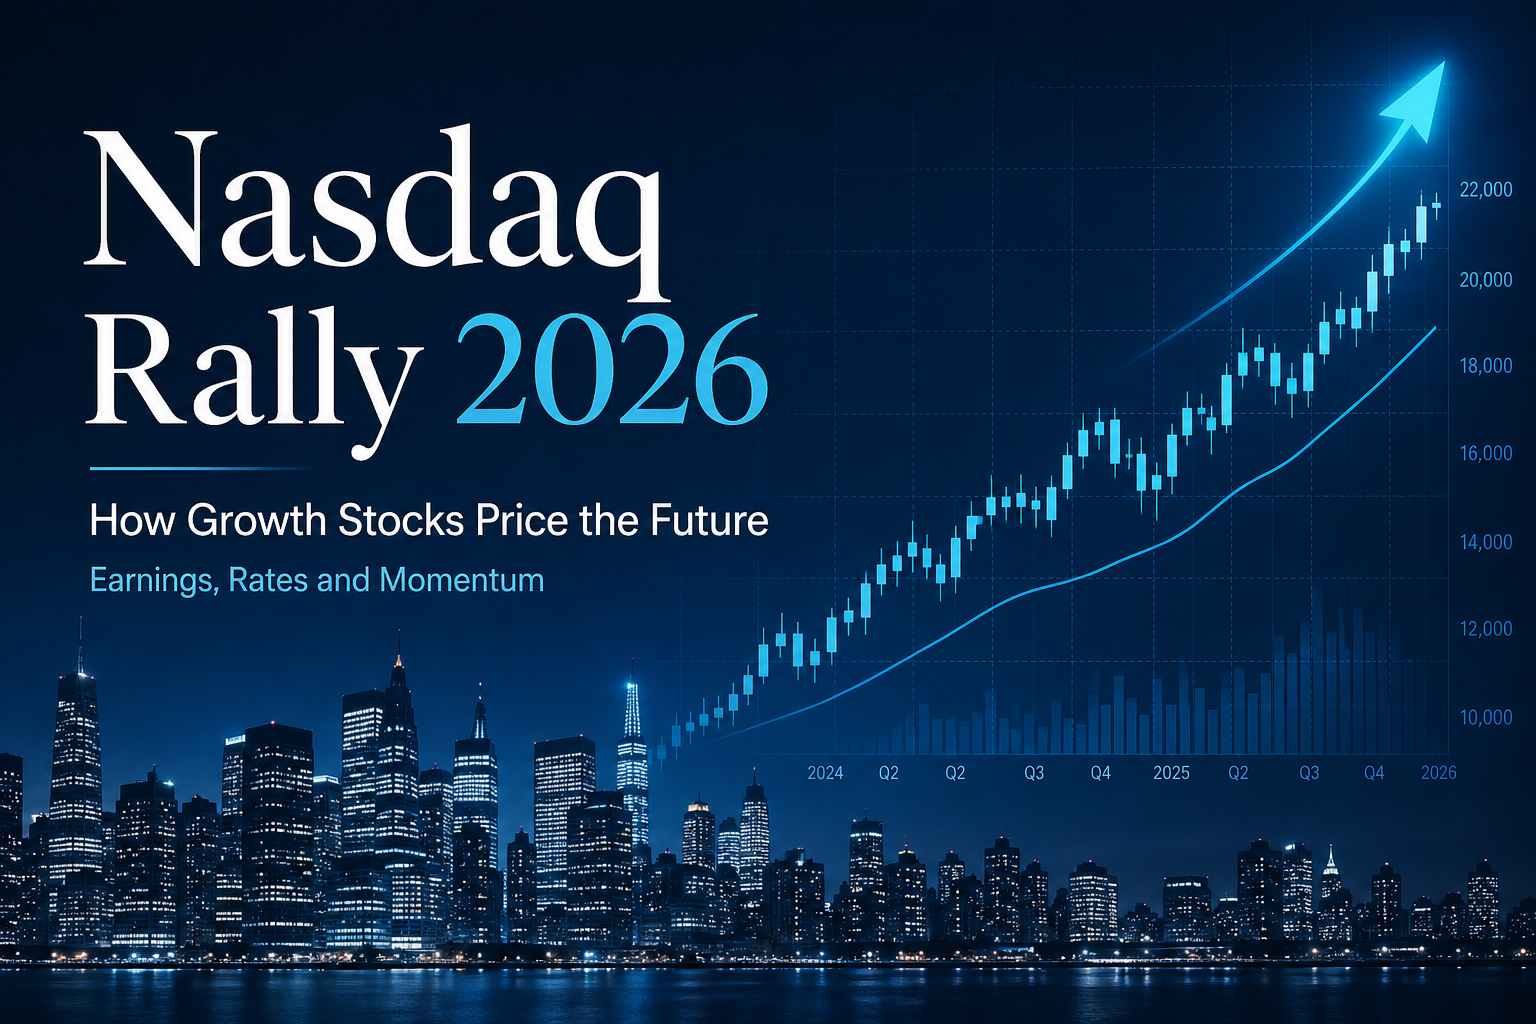
The Nasdaq’s earnings risk this week is unusually concentrated. Apple and Microsoft sit at the centre of the volatility map because their combined weight is large enough to move the index by itself, and because their guidance shapes how investors price the broader AI and growth narrative.
Add Meta, Tesla, ASML, and Texas Instruments around the same dates, plus a Fed decision, and Nasdaq becomes a calendar-driven market where the biggest moves are likely to occur at the open, not in the middle of the day.
In that setup, the most useful question is not whether Nasdaq “likes” earnings season. It is whether outcomes reinforce a coherent story across consumer demand, cloud growth, and AI capex. When those three align, Nasdaq tends to trend. When they conflict, volatility becomes the product.
Disclaimer: This material is for general information purposes only and is not intended as (and should not be considered to be) financial, investment or other advice on which reliance should be placed. No opinion given in the material constitutes a recommendation by EBC or the author that any particular investment, security, transaction or investment strategy is suitable for any specific person.