Published on: 2025-12-18
Updated on: 2025-12-18
In the latest US trading session on Wednesday, December 17, 2025, New York time, equities experienced another decline. The S&P 500 fell by approximately 1.2%, the Nasdaq dropped around 1.8%, and the Dow decreased by about 0.5%.

It marked the fourth consecutive day of declines for both the S&P 500 and the Dow, indicating that the downturn was not just a fleeting moment of panic but rather a sustained downtrend.
What made this US stock market drop stand out is the reason, as it was not a shock inflation print or a surprise from the central bank. It was a confidence hit: investors questioned how much debt and spending the next stage of the AI race will require, and whether the payoff arrives soon enough to justify today's prices.
| Index | Close | Day move | What it signals |
|---|---|---|---|
| S&P 500 | 6,721.43 | -1.2% | Broad market down, but not disorderly |
| Dow Jones | 47,885.97 | -0.5% | Old-economy/defensive tilt cushioned losses |
| Nasdaq Composite | 22,693.32 | -1.8% | Growth/AI complex did the heavy lifting (downward) |
Tech-led weakness drove a fourth straight decline, a streak that can magnify bearish headlines and sour sentiment even when the selling remains relatively concentrated.

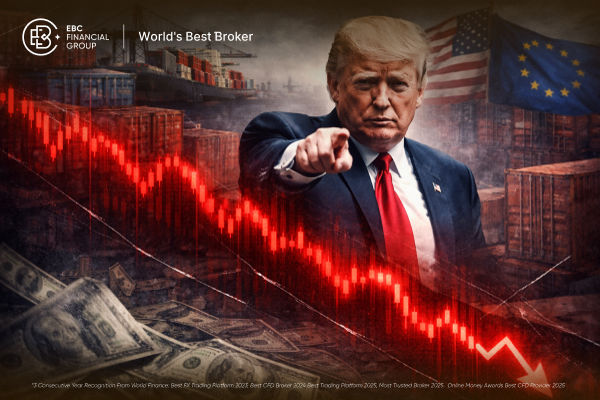
The primary explanation remains the most significant: AI bellwethers dropped sharply, and their influence is substantial enough to affect entire indices. For context, reports about a major data-centre financing plan running into trouble helped trigger a broad selloff across AI-linked names, and that pressure dragged the Nasdaq lower.
When the market's largest and most crowded winners roll over together, you get index-level damage even if plenty of stocks are green underneath.
This matters because the AI theme has been priced like a straight line: rising demand, rising spending, increasing profits. Today's market action reminded traders that spending has a limit, and funding is not always guaranteed. When doubt arises, the typical reaction is to reduce exposure to the most crowded trades.
What This Means
The market is less willing to pay "any price" for AI exposure.
Capex-heavy stories get punished first when funding anxiety rises.
Index drops can look bigger than the average stock's move because mega-caps dominate the weighting.
Even on a "stock story" day, interest rates are always in the background. Traders are still attempting to determine how much easing is feasible and how quickly it can occur.
Comments from a senior central bank official added to the rate-cut conversation, but markets have not treated it as a clear green light.
Bond yields did not need to spike for stocks to fall. When equity valuations are high, uncertainty is enough. Traders understand that a minor shift in yields or rate expectations can significantly alter the level of risk individuals are willing to hold overnight.
Late-year trading can be weird. Big funds rebalance. Some desks mitigate risk. Some investors secure gains or tax losses. When liquidity decreases, selling can drive indexes down more rapidly than usual.
There has also been recent reporting about stress in short-term funding markets, where higher repo rates can signal tighter liquidity conditions. That is not always visible on a stock chart, but it can raise caution across the whole system.
Although growth stocks declined, certain defensive sectors performed better and showed more resilience. Energy also got support from rising crude prices tied to geopolitical headlines and supply concerns.
When energy holds up while tech sinks, it often signals a shift from "risk-on" to "protect the book."
A clear technical break can transform an ordinary down day into a more significant decline. For example, major indexes fell through widely watched moving averages, which tends to trigger mechanical selling and stop-loss activity.
When leadership is narrow (a handful of mega-caps carrying performance), sell-offs can look violent because:
Passive and systematic strategies reduce exposure together,
Dealers hedge options flows mechanically,
Profits are derived from the same stocks that everyone owns.
This is why you often see the Nasdaq fall more than the Dow in these episodes: it is not just "risk-off", it is de-grossing in the most crowded winners.
It helps to think of the US stock market as two markets living together:
The story market: investors buying themes like AI, productivity, and growth.
The balance-sheet market: Investors are closely monitoring interest rates, funding costs, and the amount of leverage that the financial system can handle.
When the stock market is strong, the balance-sheet market gets ignored. When funding risk shows up, the balance-sheet market takes control. Today looked like the second one.
| Asset | Bias (Daily) | RSI (14) | MACD (12,26) | Volatility read | What it suggests |
|---|---|---|---|---|---|
| S&P 500 | Strong Sell | 27.999 | -27.85 | ATR shows high volatility | Oversold momentum; selling pressure dominant |
| Nasdaq 100 | Strong Sell | 26.442 | -172.45 | ATR high volatility | Heavier downside momentum than S&P; still fragile |
| Dow Jones | Strong Sell | 37.657 | -77.17 | ATR high volatility | Weak, but less oversold than tech-heavy indices |
| SPY (S&P 500 ETF) | Strong Sell | 28.414 | -2.66 | ATR high volatility | ETF mirrors index: oversold, but trend still down |
These are the levels that matter because they cluster around round numbers and widely watched trend references:
S&P 500
Support: 6,700, then 6,650
Resistance: 6,800, then the 6,900 area
If 6,700 does not hold on a closing basis, traders will treat bounces as sellable until momentum improves.
Nasdaq 100
Support: the most recent swing area around the 24,5xx–24,7xx zone (psychological band)
Resistance: prior breakdown area and any reclaim of key moving averages (trend repair signal)
Dow Jones
Support: 47,500–47,700
Resistance: 48,300–48,500
The Dow is the "relative strength" tell. If it stops declining while the Nasdaq continues to drop, then sector rotation will remain the key focus.

US CPI (Nov 2025) 18 Dec, 8:30 a.m. ET: The immediate catalyst for yields, the dollar, and growth valuations.
AI capex headlines: Any sign that spending plans are being delayed, financed at worse terms, or not translating into demand.
Market breadth: If most stocks start falling with tech, the risk rises from "rotation" to "risk-off".
The main driver was renewed concern about the cost and financing of AI infrastructure spending, which hit tech shares and pulled the Nasdaq lower. Rate uncertainty and late-year liquidity also added pressure.
Yes. Heavy losses in AI-linked and large tech names are the main drag on indexes, with defensive areas holding up better.
On the S&P 500, an RSI near 28 signals very weak momentum and an oversold setup.
The zones to watch are around the 200-day moving average near $6,778 and the lower volatility support zone near $6,598.
A steady close back above the 20-day area near $6,789, followed by progress toward the 50-day area near $6,827, would be an early sign that sellers are losing control.
In conclusion, Wednesday's decline was not a random wobble. It was a message that the market is less forgiving of expensive, debt-sensitive AI trades, and it is tightening risk control ahead of CPI.
If inflation data comes in benign and yields stay calm, oversold conditions can spark a sharp bounce. If CPI surprises hotter, expect tech to remain the pressure point and for rallies to meet sellers quickly.
Disclaimer: This material is for general information purposes only and is not intended as (and should not be considered to be) financial, investment or other advice on which reliance should be placed. No opinion given in the material constitutes a recommendation by EBC or the author that any particular investment, security, transaction or investment strategy is suitable for any specific person.