Published on: 2025-12-19
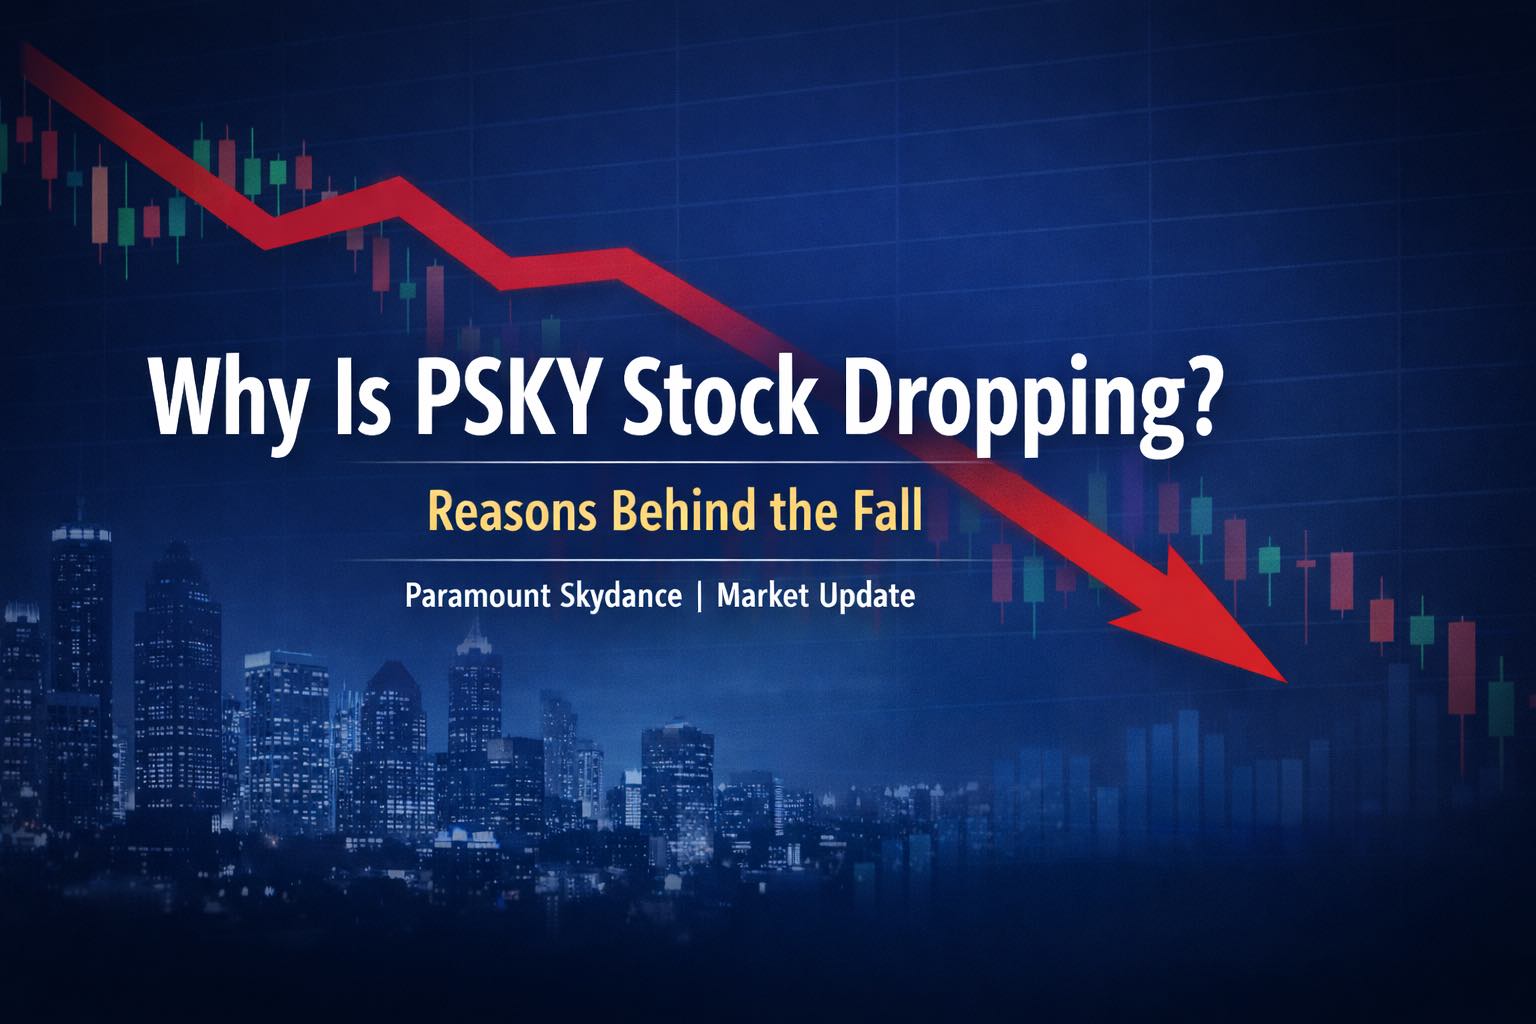
PSKY Stock has slipped back into a clear down move, and the timing is not random. The shares are getting hit by headline risk and deal uncertainty, while the chart is also flashing weak momentum.

As of the latest close shown by market data, PSKY traded around $13 and has fallen hard over the past week and month. At the same time, the stock is still up year to date, which tells you this is a sharp pullback inside a more volatile year, not a slow grind lower.
Below is a full breakdown of what is moving Paramount Skydance, and what the technical picture says right now.
Market data showed PSKY at $13.01 on December 18, 2025, down 0.69% on the day, with 7.41 million shares traded and a 52-week range of $9.95 to $20.86.
From a trader’s point of view, the bigger issue is the speed of the drop:
Weekly move: about -12%
Monthly move: about -17% (sources vary slightly by feed)
The stock is also sitting roughly 38% below its 52-week high, which matters because many funds and systematic traders reduce exposure when a name breaks down from prior highs.
Market data providers list PSKY with a market cap in the mid $14B area, which keeps it in a range where institutions can move it quickly when headlines hit.

The biggest weight on PSKY Stock is the market’s reaction to takeover headlines tied to Warner Bros. Discovery.
Reuters reported that Warner Bros. Discovery’s board rejected Paramount Skydance’s hostile bid, criticizing the offer and raising concerns around financing and deal certainty. When an acquirer’s deal terms get questioned, the acquirer’s stock often falls because investors start pricing in worst-case outcomes: higher funding costs, delays, or a revised offer that is less shareholder-friendly.
Reuters also reported on December 19, 2025 that a Warner Bros. Discovery shareholder (Harris Associates) said it would be open to a revised Paramount bid if the terms improve. That sounds supportive on the surface, but for PSKY it still signals one thing: the story is not settled, and the market hates unresolved deal risk.
Why this matters for PSKY Stock:
Even if a deal never happens, the attempt can still weigh on PSKY. Traders price in the chance that management has to sweeten terms, clarify funding, or shift strategy, and all of those can create uncertainty around future earnings and balance sheet risk.
Big acquisitions can hurt the buyer’s stock even when the strategic idea sounds good. Markets focus on two simple questions:
How much cash is required?
What happens to debt, interest costs, and future flexibility?
If investors believe the buyer may be forced into expensive financing or a “stretch” balance sheet, the stock often sells off first and asks questions later. Reuters’ reporting around deal terms and financing concerns is a key reason PSKY has been trading like a headline-driven name instead of a steady media stock.
Even without the deal narrative, Paramount Skydance operates in a tough industry mix: legacy TV, advertising cycles, and expensive streaming competition. That backdrop matters because a company trying to do large M&A is judged more harshly if its base business is not throwing off clean, steady profit.
Reuters financial data also showed weak profitability in the recent reported period (including a net loss and negative margins), which can make investors less patient during volatile headline cycles.
PSKY has also shown bursts of very heavy trading volume on large daily moves in early December (both up and down). TipRanks’ historical table shows multiple high-volume sessions around major price gaps, which is typical when fast-money traders pile in, then exit.
When that happens, the chart often becomes “fragile.” Small negative headlines can trigger stop-loss selling, margin reduction, and trend models flipping bearish.
PSKY Stock has been in a clear downswing since October, with lower highs and lower lows. The stock also broke below prior support zones in the mid-teens, and it has not reclaimed them.

To keep the numbers transparent: the indicator calculations below use the last ~50 daily sessions shown in TipRanks’ historical prices table, with the last two closes aligned to the latest market data print (Dec 17 and Dec 18).
| Indicator | Setting | Latest Reading | What it Suggests |
|---|---|---|---|
| Relative Strength Index (RSI) | 14 | 32.0 | Near oversold territory; selling pressure is strong |
| MACD | 12, 26, 9 | -0.66 | Bearish trend momentum remains in control |
| MACD Signal | 9 | -0.52 | Still below zero, confirms weak momentum |
| MACD Histogram | MACD − Signal | -0.14 | Downside momentum still outweighs rebounds |
| Simple Moving Average (SMA) | 20-day | 14.71 | Price below this is a short-term bearish sign |
| Simple Moving Average (SMA) | 50-day | 15.57 | Price well below this shows broader weakness |
| Bollinger Bands | 20, 2 | 12.80 – 16.62 | Price near the lower band, volatility elevated |
| Stochastic %K | 14 | 2.1 | Very stretched selling in the last two weeks |
| Average True Range (ATR) | 14 | 0.72 | Wide daily ranges; risk management matters |
How to read this setup:
RSI near 30 does not mean “it must bounce.” It means selling has been intense. Bounces can happen, but downtrends can stay oversold longer than people expect.
With PSKY below the 20-day and 50-day averages, rallies often meet selling pressure near those lines.
Here are practical levels that show up clearly from recent trading ranges and common market reference points.
| Level Type | Price Level |
|---|---|
| Pivot (P) | 13.07 |
| Support 1 (S1) | 12.89 |
| Support 2 (S2) | 12.77 |
| Resistance 1 (R1) | 13.19 |
| Resistance 2 (R2) | 13.36 |
These are not “magic numbers.” They are areas where short-term flows often show up, especially in a news-driven stock.
| Zone | Why It Matters |
|---|---|
| $12.95 to $13.00 | Recent intraday low area and round-number support |
| $12.52 | 23.6% Fibonacci retracement of the 52-week range |
| $14.10 to $14.15 | 38.2% Fibonacci level and a recent breakdown area |
| $14.70 to $14.75 | Near the 20-day average and prior consolidation area |
| $15.55 to $15.60 | Near the 50-day average; a key “trend line” test |
| $20.86 | 52-week high, major longer-term ceiling |
A clean reclaim of $14 to $15 would be the first sign the stock is repairing. Until then, the path of least resistance remains down.
PSKY Stock is likely to stay sensitive to a few catalysts:
Updates on the Warner Bros. Discovery situation (revised bids, responses, or financing clarity)
Any statement that reduces uncertainty (clearer terms, confirmed funding structure, or a shift in approach)
Earnings and forward commentary, especially around streaming profitability and advertising trends
Volume and price behavior around $13: if heavy selling continues on high volume, support can break quickly
If the news flow cools down, the chart will matter more. If headlines keep coming, technical levels can get ignored in the short run.
The drop is closely tied to takeover-related uncertainty and investor concern around deal terms and financing, alongside a weak technical setup.
Recent market data showed PSKY around $13.01 on December 18, 2025.
On common momentum measures, it is close. The RSI reading is near 32, which is near oversold territory, but oversold signals can persist in downtrends.
The nearest support zone is around $13, then near $12.77 to $12.89 on short-term pivot math, with deeper support levels lower down.
Traders typically want to see PSKY reclaim key breakdown areas, especially above $14, and then hold above the 20-day moving average with improving volume.
PSKY Stock is dropping for a simple mix of reasons: heavy deal-driven headline risk, questions around financing and valuation, and a chart that still points lower. The latest slide looks more like a confidence reset than a one-day overreaction. When markets start doubting deal certainty, buyers usually get punished first, and that pressure can linger until terms, funding, and timelines become clearer.
From a technical view, the stock is trading below key moving averages and momentum is still weak, even if the RSI is now near oversold levels. That combination can produce short bounces, but it does not automatically mean the trend has turned.
For PSKY to stabilise, traders will want to see selling volume fade, support near the low-teens hold, and price reclaim key breakdown areas around the mid-teens. Until that happens, the balance of risk stays tilted to more volatility, with every fresh update on the Paramount Skydance storyline likely to move the stock quickly.
Disclaimer: This material is for general information purposes only and is not intended as (and should not be considered to be) financial, investment or other advice on which reliance should be placed. No opinion given in the material constitutes a recommendation by EBC or the author that any particular investment, security, transaction or investment strategy is suitable for any specific person.