Published on: 2025-12-11
Updated on: 2025-12-11
The S&P 500 is closing out 2025 just below its record, trading around 6,886 after the Fed's final rate cut of the year and a 17% year-to-date gain. Volatility is middling rather than extreme, with the VIX parked in the mid-teens, signalling investors are optimistic but not quite euphoric.

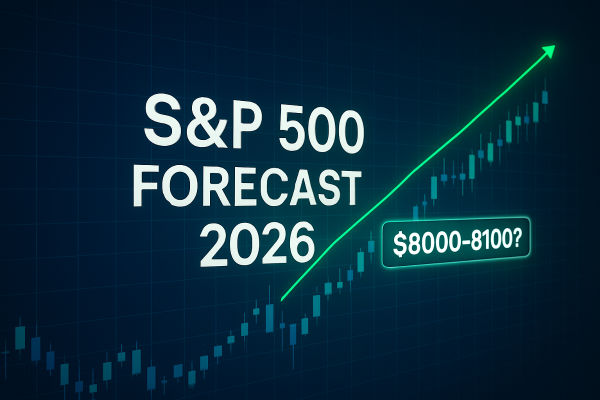
Into that backdrop, a growing list of big houses is now openly talking about an 8,000–8,100 S&P 500 by end-2026. Oppenheimer leads with the Street-high target of 8,100, followed by Deutsche Bank and Capital Economics at 8,000, Morgan Stanley at 7,800, JPMorgan at 7,500, and a more cautious Bank of America at 7,100.
So the obvious question for 2026 is simple: does the earnings and macro math really justify 8k–8,100, or is the market getting ahead of itself?
| Metric | Latest reading (approx.) | Comment |
|---|---|---|
| S&P 500 level | 6,886.68 | Just under record closing high. |
| YTD performance (2025) | +17.1% | Strong back-to-back years after 2023–24 gains. |
| Forward 12-month P/E | ≈22–23× | Above 5- and 10-year averages. |
| Consensus EPS growth 2026 | ≈14–15% | FactSet and multiple strategists cluster here. |
| Bottom-up 12-month target | 7,968 (≈+16% vs 6,857) | Implies level just under 8,000. |
| VIX (spot) | ~16 | Moderate, not panic, volatility. |
Level: 6,886.68 at the 10 December close, a few points below the early-October record around 6,895.
YTD performance: roughly +17.1% in 2025, with the Nasdaq up about 22.5%.
Volatility: VIX hovering between 15–17, above the ultra-calm lows of 2023 but far from stress levels.
Fed policy: Funds rate now 3.5–3.75% after three cuts in 2025, with the Fed pencilling in only one more cut in 2026.
Latest earnings insight puts the forward 12-month P/E at about 22.4, above the 5-year average (20.0) and the 10-year average (18.7). Analysts expect 2026 earnings growth of about 14.5%.
| Firm / strategist | 2026 target | Implied vs ~6,880 now | 2026 EPS assumption (approx.) |
|---|---|---|---|
| BofA | 7,100 | +3–4% | $310 |
| SocGen | 7,300 | +6–7% | $310 |
| Barclays | 7,400 | +7–8% | $305 |
| CFRA | 7,400 | +7–8% | n/a (EPS positive) |
| UBS | 7,500 | +9% | $309 |
| HSBC | 7,500 | +9% | $300 |
| JPMorgan | 7,500 | +9% | $315 |
| Yardeni | 7,700 | +12% | $310 |
| RBC | 7,750 | +13% | $311 |
| Morgan Stanley | 7,800 | +13–14% | $317 |
| Wells Fargo | 7,800 | +13–14% | $310 |
| Deutsche Bank | 8,000 | +16% | $320 |
| Capital Economics | 8,000 | +16% | Not explicit, mid-teens growth |
| Oppenheimer | 8,100 | +18% | "Strong earnings, resilient US" |
So: the consensus "bullish but not crazy" range is 7,100–7,800. The 8,000–8,100 zone is the upper right-hand corner of current mainstream forecasts, not some fringe fantasy.

The macro setup going into 2026:
Fed: Policy rate at 3.5–3.75% after the December cut, signalling only one more cut in 2026.
GDP: Several major houses expect U.S. growth around 2–2.5% in 2026, with a temporary boost from tax refunds and AI investment.
AI infrastructure: Strategists all lean on AI-driven capex as a key driver for profits and equity demand.
Research points to S&P 500 earnings growth of roughly 14–15% in 2026, with revenue growth around 7%.
The macro story that justifies 8k looks something like this:
No U.S. recession.
Tariffs and policy noise stay contained.
AI spending actually translates into real margins and cash flow, rather than just bloated capex lines.
If any of those break, 8,000 turns from "ambitious" to "unrealistic" very quickly.
Two vital points from the latest earnings work:
FactSet's bottom-up 2026 EPS estimate has surpassed $300, with some brokers now targeting a fair range of $305–320.
Revisions for 2026 flipped from negative to modestly positive in recent weeks, helped by stronger Q3 numbers and better guidance from AI-exposed tech.
Markets have already rewarded that: forward P/E has climbed above 22×, even as earnings estimates rose.
So the bar is high. To push another one or two multiple turns higher, the tape needs ongoing EPS upgrades and a Fed that doesn't suddenly turn hawkish again.
| Metric / level | Approx. value | Read-through |
|---|---|---|
| Last close | 6,886 | Just under all-time highs; bulls still in control. |
| All-time high (close) | ~6,891 | A weekly close above here opens the path to 7,000+. |
| 5-day MA | ~6,860 | Very short-term trend still pointed higher. |
| 50-day MA | ~6,750–6,780 | First major dynamic support; recent dip was bought. |
| 200-day MA | ~6,200–6,230 | Long-term trend line; a cyclical bull market usually survives while price stays above this. |
| RSI (14) on SPY proxy | ~63 | Positive momentum, not yet a blow-off. |
| % of stocks above 50-day MA | ~54% | Breadth improving after AI-heavy leadership. |
| % of stocks above 200-day MA | ~51% | Enough participation to validate the bull, but not a stampede. |
| Short-term support | 6,650–6,680 | Zone of recent bounce; a break here invites a move to 6,500. |
| Deeper support | 6,500, then 6,200 | 6,200 (200-day) is the line between a healthy correction and a more serious trend shift. |
| Near-term resistance | 6,900–7,000 | Psychological level; a clean breakout could turn 7,000 into new support. |
On the technical side, the S&P 500 is still in a healthy uptrend. From a pure chart perspective, there's nothing here that rules out 8,000.
A very rough rule of thumb: if the index advances 15–20% from a major crash low, consolidates and breaks higher with higher lows, a further 10–15% extension over the next year is entirely normal in a mature bull market.
From 6,886 to 8,000 is about a 16% move (6,886 × 0.16 ≈ 1,101; 6,886 + 1,101 ≈ 7,987). That's perfectly in line with standard bull-market extensions, if the macro and earnings story cooperate.

Level: somewhere around 7,300–7,800 by late 2026.
Assumptions:
Earnings grow 13–15% in 2026, landing EPS roughly in the $305–310 range.
Forward P/E settles around 22–23×, not far from today's level.
Fed cuts once or twice more and then sits tight; no U.S. recession.
Under that mix, you're looking at something like:
7,500 = $310 × 24.2× (a mild premium), or 7,600 = $310 × 24.5×.
Level: 8,000–8,100 by end-2026.
Assumptions:
Earnings land towards the top end of the range, say $315–320.
Forward P/E stretches to 25–26× as investors lean further into AI and the "no-recession" story.
Fed delivers a little more easing than it currently signals, and the bond market stays calm.
In that environment, the 8,000–8,100 prediction looks achievable.
Level: 5,500–6,000 on a deep reset.
Assumptions:
AI capex looks over-built; margins compress, and earnings disappoint.
The Fed is forced to stay tighter than expected, or a shallow recession appears.
The market de-rates back toward 16–18× earnings.
Bank of America openly talks about 5,500 as a plausible bear case if the U.S. tips into a typical recession, roughly a 20% drawdown from current levels.
The takeaway: 8,000–8,100 is a credible bull outcome, not the base case. To get there, you need both the earnings and the multiple to work in your favour.
It's mainstream bullish rather than fringe. However, consensus is closer to 7,300–7,800.
Around $305–320 EPS for 2026. At 8,000, that implies a 25–26× P/E, higher than today's 22–23× and well above long-run averages around 18–19×.
Yes, Bank of America's own bull case stretches to 8,500, and a strong AI-driven blow-off phase could push valuations further.
For longer-term investors, a clean break below 6,500–6,600 would be a warning that the November lows have failed and buyers are stepping back.
Can the S&P 500 reach 8,000–8,100 by the end of 2026? Yes, it can, as the numbers line up.
But to get there, you need earnings to land toward the top of current forecasts and the market to accept a forward multiple in the mid-20s. The more likely outcome is that the index ends up around the 7,300–7,800 band, with 8,000 acting as the upper edge of a bullish but plausible range.
For traders and investors, the message is simple: respect the uptrend, respect the earnings power, but respect valuation and cycle risk just as much.
Disclaimer: This material is for general information purposes only and is not intended as (and should not be considered to be) financial, investment or other advice on which reliance should be placed. No opinion given in the material constitutes a recommendation by EBC or the author that any particular investment, security, transaction or investment strategy is suitable for any specific person.