Published on: 2026-05-27
Updated on: 2026-05-27
Wall Street returned from the Memorial Day long weekend with a historic vengeance. In a powerful display of market resilience, benchmark U.S. indices hit all time highs on Tuesday as a relentless artificial intelligence boom combined with optimism surrounding global diplomacy. The market's performance proved that investors are more than willing to look past sticky domestic inflation in favor of blockbuster corporate earnings.
By the closing bell, the tech-heavy Nasdaq Composite and the broad-based S&P 500 had secured fresh closing records, while the small-cap Russell 2000 staged a massive breakout to join its larger peers. As momentum sweeps through equity markets, financial analysts are watching closely to see how long this structural rally can sustain its current pace.
The session underscored the immense strength of the current bull market. For months, critics argued that the equity rally was top-heavy, relying almost exclusively on a handful of mega-cap tech stocks. However, Tuesday's trading session shattered that narrative. The fact that U.S. indices hit all time highs simultaneously across large, tech, and small-cap sectors indicates a healthy rotation of capital rather than an isolated bubble.
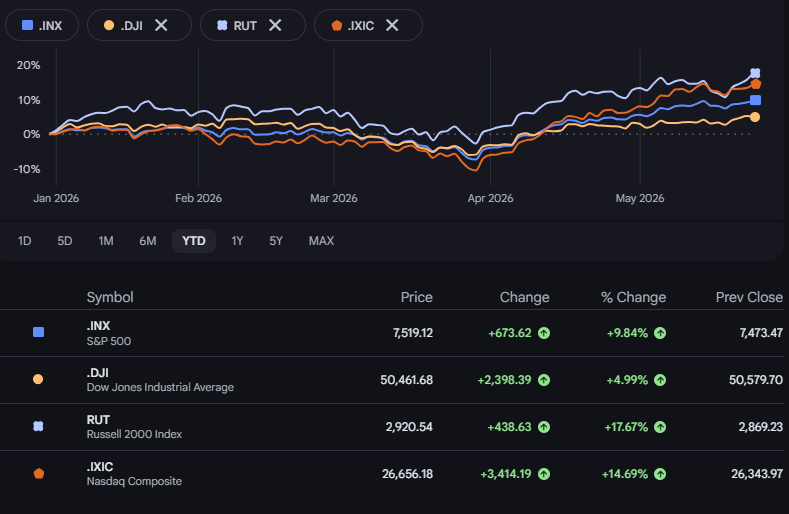
The S&P 500 gained 45.65 points, or 0.61%, to finish at a record 7,519.12, after setting an intraday high of 7,539.09. Not to be outdone, the Nasdaq Composite jumped 312.21 points, or 1.19%, closing at 26,656.18. pushed by a jaw-dropping acceleration in the semiconductor space.
Perhaps the biggest surprise of the day came from the Russell 2000. The small-cap index surged 51.31 points, or 1.8%, to close at 2,920.54. Small companies are typically highly sensitive to interest rates and regional economic health; their sudden breakout past heavy resistance suggests that broader economic confidence is finally filtering down beyond Silicon Valley giants.
The sole outlier to the euphoric session was the blue-chip Dow Jones Industrial Average. The Dow slid 118.02 points, or 0.23%, to close at 50,461.68. weighed down by a slight pullback in defensive healthcare and traditional industrial shares as capital aggressively shifted into growth assets.
It is impossible to discuss why U.S. indices hit all time highs without focusing on the semiconductor sector. The Philadelphia SE Semiconductor Index went on an absolute tear, skyrocketing 5.5% in a single day to hit an all-time high of 12,876.91.
The undisputed star of the session was Micron Technology (MU). The memory chipmaker made history by officially surpassing a $1 trillion market capitalization, closing up nearly 19% at $895.88 after touching an intraday high of $916.80. Investors piled into the stock following a massive price target upgrade from UBS, which hiked its projection to $1.625 per share.
The enthusiasm surrounding Micron highlights a crucial fundamental reality: the AI supply chain is severely supply-constrained, ensuring massive revenue visibility. Micron recently confirmed that its entire supply of High Bandwidth Memory (HBM) chips for the remainder of 2026 is completely sold out.
Other chipmakers rode Micron's coattails:
Qualcomm climbed 4.5% following reports of a lucrative new chip-supply agreement with TikTok's parent company, ByteDance.
Marvell Technology surged 6.0%, capitalizing on advanced packaging and data center infrastructure needs.
SK Hynix, trading in international sessions, followed Wall Street's lead to break past its own $1 trillion valuation milestone.
While technology supplied the raw power, macroeconomics and global diplomacy provided the necessary tailwinds that ensured U.S. indices hit all time highs.
Markets reacted favorably to comments from President Donald Trump, who indicated that negotiations regarding a U.S.-Iran peace agreement were "proceeding nicely." The prospect of resolving deep-seated tensions in the Middle East sparked immediate relief across global trading desks.
Market Impact: Hopes for an end to shipping disruptions through the Strait of Hormuz immediately caused U.S. Treasury yields to ease. Lower bond yields remove a major competing force for equities, making high-growth stocks significantly more attractive to institutional fund managers.
Concurrently, corporate fundamentals have drastically outpaced expectations. As the first-quarter earnings season winds down, LSEG data shows that year-on-year corporate earnings growth for the S&P 500 is tracking at a spectacular 29%. Just a month ago, analysts had penciled in a far more modest 16.1% growth rate. This massive fundamental beat has provided an ironclad floor for equity valuations.
| U.S. Stock Index | Tuesday Closing Value | Daily Percentage Change | Year-to-Date Performance |
| S&P 500 | 7,519.12 | +0.61% | +9.8% |
| Nasdaq Composite | 26,656.18 | +1.19% | +14.7% |
| Russell 2000 | 2,920.54 | +1.80% | +17.7% |
| Dow Jones Industrial Average | 50,461.68 | -0.23% | +5.0% |
Despite the celebration on trading floors as U.S. indices hit all time highs, a distinct economic divergence continues to manifest on Main Street. On the very same day stocks tore into record territory, fresh data highlighted the growing friction facing everyday American consumers.
The Conference Board released its May consumer confidence index, which ticked downward by 0.7 points to 93.1. This marks a stark contrast to soaring stock prices. Decades of structural inflation, compounded by nationwide average gas prices hovering around $4.49 a gallon since the geopolitical flare-ups in February, are actively eroding real disposable income.
Economists point to this phenomenon as a textbook "K-shaped" economic profile. Wealthier households, who hold significant portions of their net worth in equity portfolios, are seeing their financial positions expand rapidly. This wealth effect keeps luxury and core retail spending afloat. Conversely, lower-income households are actively cutting back, forced to reallocate capital toward nondiscretionary items like groceries and fuel, driving outperformance in discount retail sectors while broader consumer sentiment metrics languish.
With the news that U.S. indices hit all time highs, technical analysts are waving early yellow flags regarding market overextension. Trading volume across U.S. exchanges surged to 18.85 billion shares on Tuesday, noticeably higher than the 20-day full-session average of 18.71 billion, confirming intense institutional participation.
However, a deeper look at chart indicators reveals a mild technical divergence. While the structural breakout in the Russell 2000 shows genuine capital rotation, both the Nasdaq Composite and the S&P 500 are flashing Moving Average Convergence Divergence (MACD) "sell" triggers on their daily charts.
When an entire index or sector doubles its valuation in a compressed multi-month window, technical gaps inevitably form. If the market encounters an unexpected macroeconomic speed bump—such as an unexpected inflation print or a hitch in international peace talks—a short-term retest of lower support levels (such as 8,300 on the equal-weighted S&P) should be expected. Long-term investors view these potential pullbacks not as systemic threats, but as vital buying opportunities to pick up shares at a discount.
The historic trading session proved that Wall Street remains an unstoppable engine driven by structural innovation. The headline that U.S. indices hit all time highs is a testament to an economy where monumental corporate earnings and an unprecedented AI capital expenditure cycle can comfortably overpower localized consumer anxieties.
Led by Micron's entrance into the trillion-dollar club and a long-awaited breakout from small-cap stocks via the Russell 2000, equities have clearly demonstrated that the path of least resistance remains upward. While short-term technical indicators suggest the market might be due for a brief breather, the overwhelming fundamental strength of corporate balance sheets suggests that the multi-year bull market has plenty of runway left to explore.