Published on: 2026-07-10
Updated on: 2026-07-10
A widely traded commodity with various industrial and investment applications. That’s gold!
The chip in the microwave, the motherboard behind a smart fridge's display, the connectors in our wiring – gold seems to hold so many unseen uses and needs. In spite of that, the actual amount of gold in your home appliances adds up to so little it probably couldn’t fill your coffee cup. Yet it’s the same metal that set record highs in 2025 and broke US$4,000 per ounce for the first time ever.
So what we’re seeing here is a disparity between the real-world industrial use and market price valuation. Keep these two factors in mind, because in the gap between them lies one of the market’s biggest puzzles, and the key to understanding the gold market.
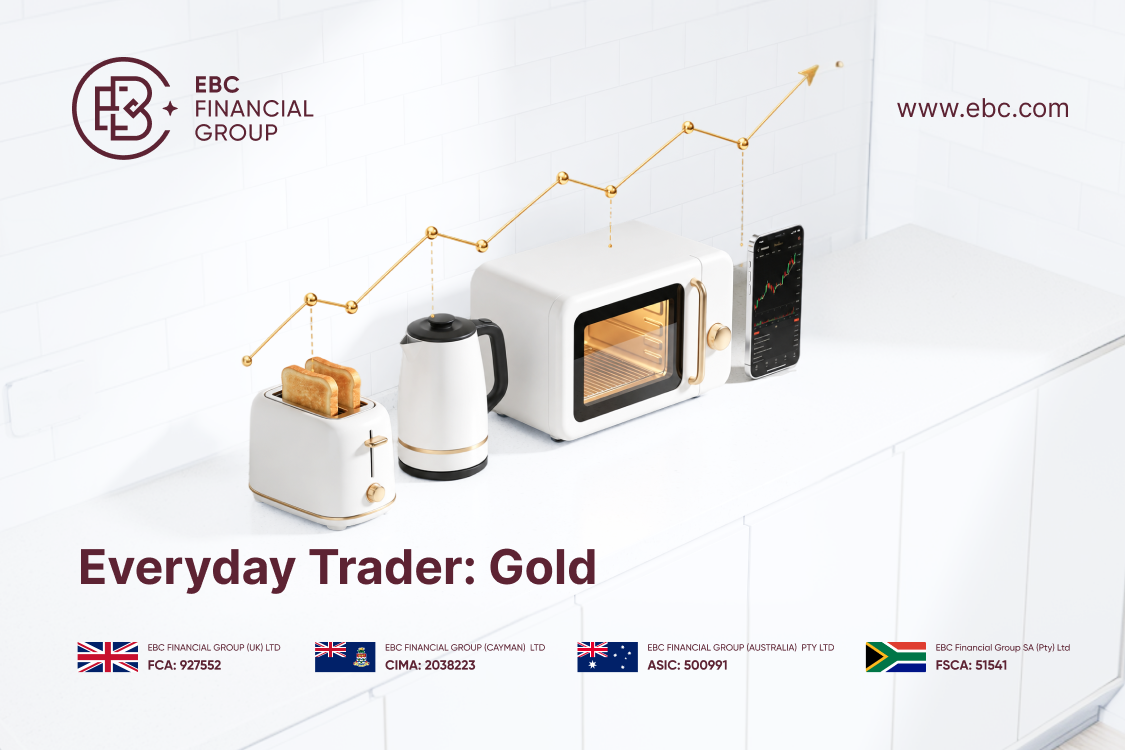
To put it simply: gold’s value seems irrational in relation to its function. Across the globe in 2025, industrial usage amounted to an estimated 320 tonnes of gold, yet total demand topped 5,000 tonnes for the first time on record, valued at over US$500 billion. As we can see, industrial use accounts for only a small fraction of total demand. Investors — buying bars, coins, and ETFs — took more than half the market, while central banks bought another 863 tonnes of gold.
Gold does not corrode, rust, tarnish, rot, or react. It's unique, scarce, and beautiful, and one of the least reactive elements. It is not consumed, does not decay, and, to paraphrase Warren Buffett, produces nothing. No yield, no dividend, no harvest. With regard to the value of gold, this so-called weakness is also its greatest strength, as a valuable commodity.
Every one of its physical qualities reinforces why gold was historically considered a monetary standard. A rare metal that won't corrode can store value almost indefinitely. Its malleability allows it to be repurposed into bars or plated into a circuit. Gold is gold, and gold is valuable – a universally understood market asset and concept. In essence, gold’s use as a store of value and in electronics are similar – it’s timeless, unchanging, and ever reliable. Let’s look at how this translates into investor demand.
If usefulness sets a floor, what else could stack the rest of the price on top? A common explanation is the simple power of belief. The historical significance of this shiny, inert metal as a place for value to weather a storm. In many ways, gold’s valuation seems to move with forces that are more psychologically driven than industry- or manufacturing-driven.
When interest rates fall. Gold pays no interest, so it can look like a more stable choice when bonds yield less interest. It tends to react inversely to interest rate movements.
When the dollar weakens. Gold is priced in dollars, so a softer dollar makes it cheaper for investors to hoard.
During periods of economic uncertainty or market volatility. Investor demand for gold may increase. In times of stress and inflation, money has often been redirected towards assets that the government cannot print. Safe-haven and investment hype — rather than industry need — are widely credited with 2025's run, which set 53 record highs and pushed past US$4,000 an ounce for the first time.
Now that we have a clearer picture of the dynamic nature of this commodity, let’s look at how this asset may be introduced into a trader’s portfolio:
Solid Physical Gold: Bars, coins, or jewellery. We directly own the commodity, but it has to be stored and insured, creating a gap between the buying and selling prices.
Gold ETFs: Gold ETFs are publicly traded funds that hold a basket of gold or gold-related derivatives, or mining company shares, tracking the performance of gold.
Spot Gold (XAUUSD): An over-the-counter price-tracking contract that follows the spot price of the wholesale gold market, against the dollar. One of the more direct ways to take a position on the price of gold itself – and what you'll find on EBC's commodities page.
Keen to learn and understand how you can trade Gold (XAUUSD) better? Refine your trading game with these industry gold-standard, high-quality resources:
What You Can Find |
Where To Find It |
URL |
Demand by Sector/Country, Price History, Quarterly Gold Demand Trends, Mid-Year/Full-Year Outlooks |
World Gold Council - Gold Hub |
|
LBMA & Shanghai reference prices, updated weekly |
World Gold Council - Gold Prices |
|
Full sector time series (Jewellery / Tech / Investment / Central Banks) from 2010 |
World Gold Council – Gold Demand By Country |
|
The Benchmark Gold Price (AM/PM auction) |
London Bullion Market Association |
|
Mine production, reserves, industrial uses of gold |
U.S. Geological Survey -National Minerals Information Centre |
https://www.usgs.gov/centers/national-minerals-information-center |
Live spot chart & daily commentaries |
Trading Economics |
|
Historical price series for charting |
Federal Bank of St Louis |