Published on: 2023-06-01
Updated on: 2025-01-14
As many stock traders know, the MACD is one of the most commonly used indicators among various technical stock indicators. It plays a crucial role in analyzing Stock Prices. However, many stock market enthusiasts may not be fully familiar with the MACD. Let's delve into what the macd indicator is and how to interpret its signals.

What is the MACD Line?
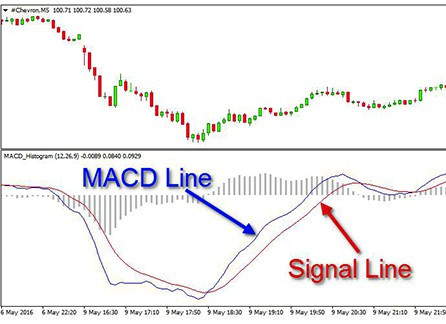
The MACD, also known as the Moving Average Convergence Divergence, is a significant trend indicator derived from the dual exponential moving average. The MACD consists of five main components: the long-term moving average (MACD line), the short-term moving average (DIF line), the red histogram bars, the green histogram bars, and the zero line. The MACD uses the interaction between the long-term MACD and the short-term DIF to signal the current market conditions and potential future trends in stock prices. The MACD, like other moving averages, is considered one of the lagging indicators, meaning it reflects past price movements and may signal changes after they have already begun.
Definition of MACD
The Moving Average Convergence Divergence (MACD) is a pivotal tool in technical analysis, designed to gauge the momentum of a security’s price movement. This trend-following momentum indicator reveals the relationship between two exponential moving averages (EMAs) of a security’s price. By analyzing the convergence and divergence of these moving averages, the MACD indicator helps traders and analysts identify changes in market trends, anticipate potential shifts in trading, and provide informed advice to clients. The MACD is particularly valued for its ability to highlight the underlying strength or weakness of a price movement, making it an essential component in the toolkit of any serious market participant.
How is MACD Calculated?
Calculating the MACD involves a straightforward yet insightful process. It starts with subtracting the 26-period EMA from the 12-period EMA, resulting in the MACD line. This line is then plotted on a chart to visualize the trend. Accompanying the MACD line is the signal line, which is a 9-period EMA of the MACD line. The interaction between these two lines is crucial for generating Trading signals. Additionally, the MACD histogram, which represents the difference between the MACD line and the signal line, provides a visual representation of the trend’s strength. When the MACD line crosses the signal line, it can indicate potential buy or sell opportunities, making these components vital for effective technical analysis.
How to Read MACD Line Crosses?
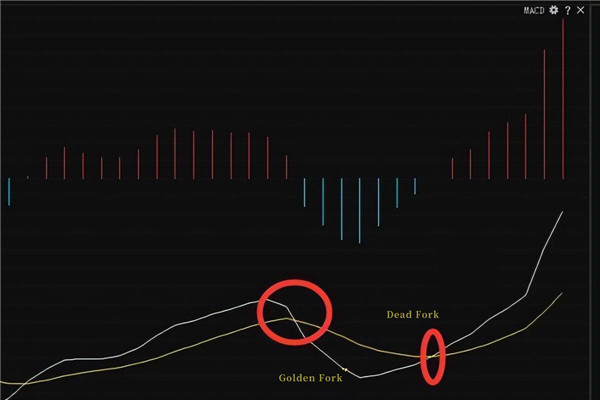
When investors buy stocks, they should follow the law of buying with a golden fork and selling with a dead fork. MACD has two lines: red belongs to the fast line, blue belongs to the slow line, and red fluctuates more and blue fluctuates less. When the red line on the MACD crosses the blue line, it is the golden cross of the MACD. Generally, the stock is not easy to fall after the golden cross, so the appearance of the golden cross is a signal to buy the stock. This is known as a bullish signal, indicating potential upward momentum. On the contrary, when the red line crosses the blue line, it is a dead cross, and the dead cross is a signal to sell the stock. This is known as a bearish signal, indicating potential downward momentum.
Interpreting the Signal Line and Histogram Bars
Investors can also monitor the red and green histogram bars, which indicate the strength of bullish and bearish positions. When the MACD histogram is red and expanding, it usually suggests that the stock market is in a strong upward trend, signaling a buying opportunity. These histogram bars help investors identify price trends and measure the momentum of these trends. When the red histogram starts to contract, it indicates waning upward momentum, signaling a potential selling point.
Similarly, when the histogram is green and expanding, it indicates a rapid decline in the market, signaling to sell. When the green histogram starts to contract, it often means the sharp decline phase is ending, signaling a potential buying opportunity.
Bull and Bear Divergences
Additionally, divergences between the MACD and stock prices can provide critical signals. A “bullish divergence” occurs when the stock price reaches a higher high than the previous wave, but the MACD peaks lower. This indicates a potential quick decline in stock price. Conversely, a “bearish divergence” happens when the stock price hits a lower low than the previous wave, but the MACD troughs higher. This signals a potential quick reversal and rise in stock price.
Conversely, if the MACD line crosses below the signal line, it may signal a bearish trend, prompting a sell decision. This is known as a bearish crossover, indicating that bearish market sentiments may be taking over.
The MACD histogram further aids in this analysis by measuring the trend’s strength. MACD crossovers, where the MACD line interacts with the signal line, are critical in confirming prevailing market trends and suggesting further price movements.
Example of MACD in Action
To see the MACD indicator in action, consider analyzing the price movement of a stock. Suppose the MACD line is above the signal line; this scenario typically indicates a bullish trend, suggesting a buying opportunity. Conversely, if the MACD line crosses below the signal line, it may signal a bearish trend, prompting a sell decision. The MACD histogram further aids in this analysis by measuring the trend’s strength. A histogram above the zero line signifies a robust bullish trend, while one below the zero line indicates a strong bearish trend. This practical application of the MACD indicator helps traders make informed decisions based on the observed price movement and trend strength.
Comparison to Other Indicators
The MACD indicator often stands out when compared to other technical indicators like the Relative Strength Index (RSI) and the Stochastic Oscillator. While RSI and Stochastic Oscillator are adept at identifying overbought and oversold conditions, the MACD excels in pinpointing changes in market trends. This unique capability makes the MACD a preferred choice for many traders. Moreover, the MACD is frequently used alongside other indicators, such as moving averages and trend lines, to confirm trading signals. This combination enhances the reliability of the signals and provides a more comprehensive view of the market conditions.
Limitations of MACD
Despite its strengths, the MACD indicator is not without limitations. As a lagging indicator, it reflects past price movements, which can result in delayed signals. This delay might cause traders to miss some gains or enter the market at suboptimal times. Additionally, the crossover strategy, while popular, can sometimes generate late signals, and the momentum divergence strategy might signal reversals prematurely. These limitations underscore the importance of using the MACD in conjunction with other indicators or time frames to confirm trading signals. By doing so, traders can mitigate the risks associated with relying solely on the MACD and enhance their overall trading strategy.
Limitations of the MACD Indicator
While MACD is an essential indicator for gauging stock market conditions, relying solely on it has limitations. Many factors influence the stock market, and investors must perform comprehensive analyses. The MACD should be used as one of many tools in an investor’s toolkit. MACD crossovers, while useful, can sometimes generate late signals, and it is important to complement them with other indicators. MACD indicators are essential tools for identifying momentum and potential trading signals through crossovers and divergences. Signal line crossovers, where the MACD line crosses the signal line, are key signals derived from the MACD indicator, but they should be validated with other indicators to avoid false signals.
Although stocks can generate high returns, they are also high-risk investments. To invest in stocks successfully, investors need to have strong risk tolerance and possess some professional knowledge and skills in stock market analysis. Otherwise, entering the market without adequate preparation can lead to significant losses.
Disclaimer: This material is for general information purposes only and is not intended as (and should not be considered to be) financial, investment or other advice on which reliance should be placed. No opinion given in the material constitutes a recommendation by EBC or the author that any particular investment, security, transaction or investment strategy is suitable for any specific person.