In the world of Smart Money Concepts (SMC), one technique that has gained growing attention among advanced traders is SMT Divergence. Short for Smart Money Technique Divergence, it offers a unique lens through which traders interpret institutional behaviour via price action.
This guide will walk you through the core principles, trading applications, chart examples, and strategic use of SMT Divergence for trading various markets.
What Is SMT Divergence?

SMT Divergence refers to a situation where two correlated assets—such as major currency pairs, indices, or equities—exhibit a divergence in their highs or lows.
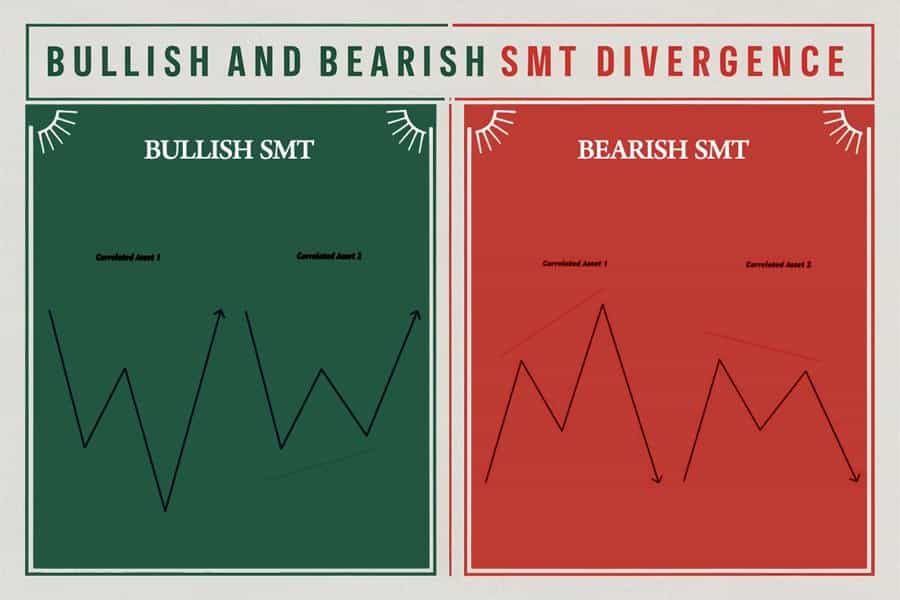
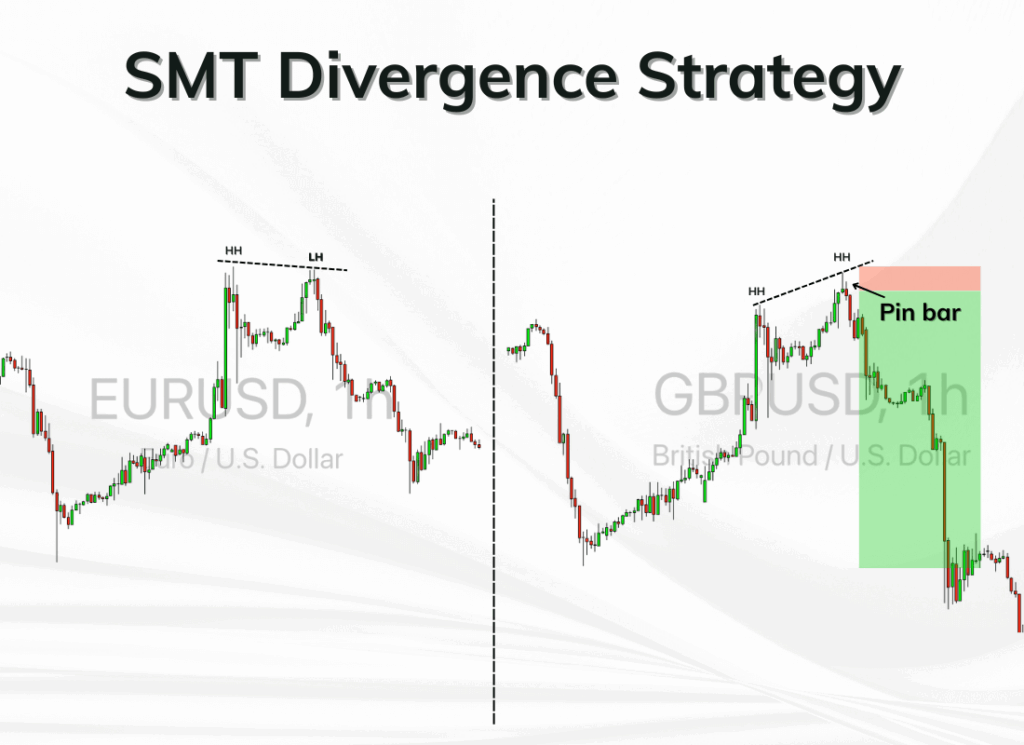
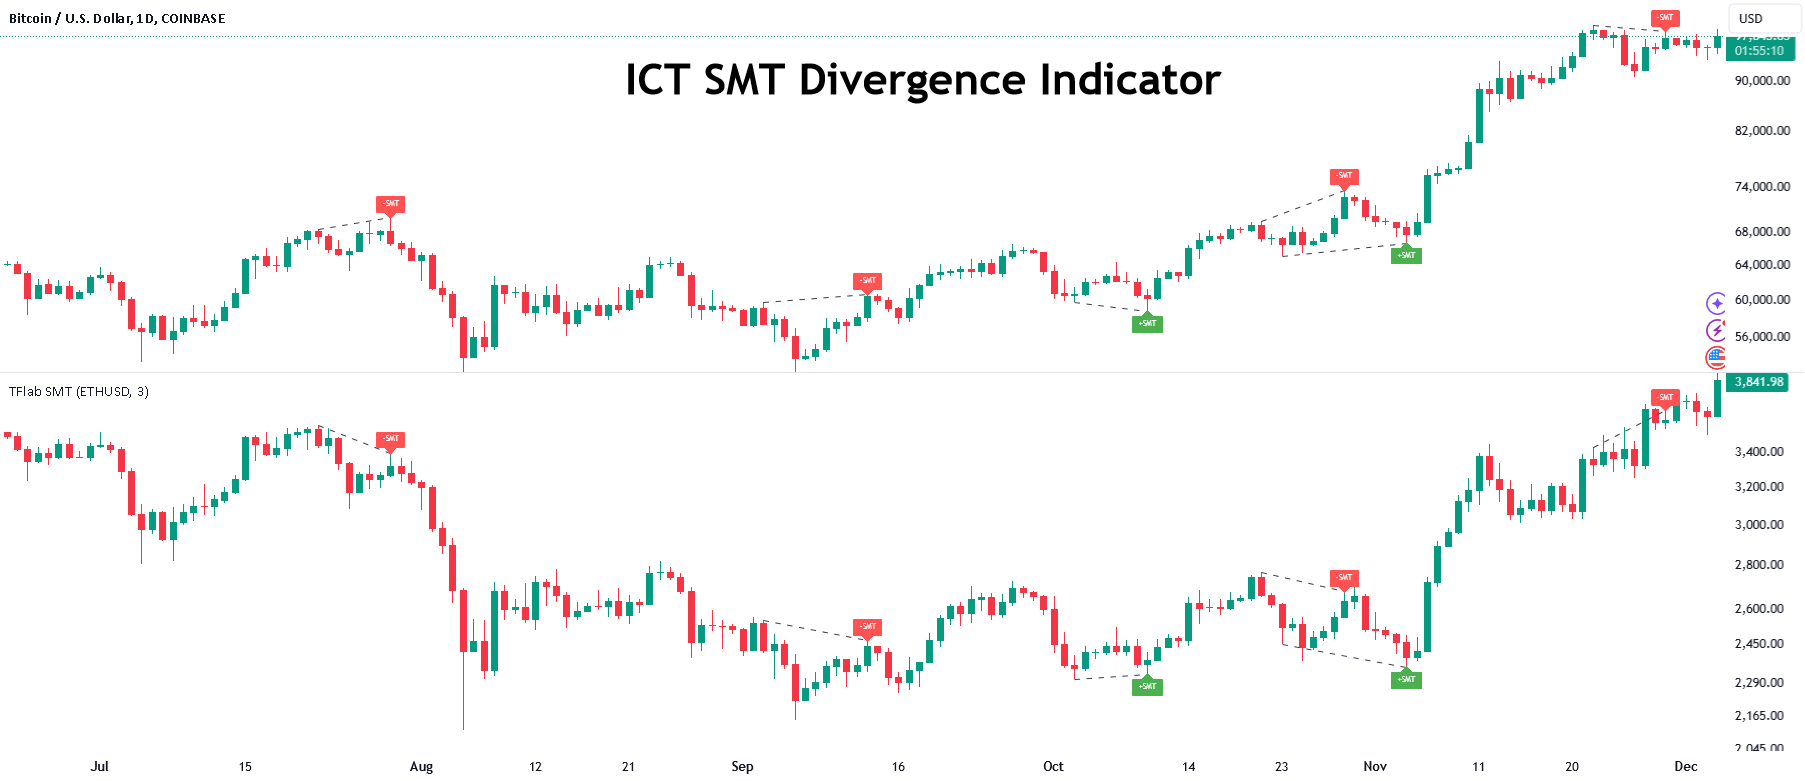
In simple terms, one asset makes a higher high while the other fails to do so (or vice versa), suggesting a potential reversal or institutional manipulation. Traders use this as a clue that "smart money" may be positioning itself ahead of a bigger move.
This concept is rooted in inter-market analysis and aims to capture subtle shifts in capital flow that retail traders may not easily detect.
Types
1. Bullish SMT Divergence
Occurs when:
It suggests that the second asset is showing relative strength, and smart money may be accumulating positions.
2. Bearish SMT Divergence
Occurs when:
It signals that the second asset is lagging, and distribution may be underway. The divergence is most effective near key liquidity zones or institutional price levels.
How Does SMT Divergence Work?

The basic principle is to observe how two related instruments behave at similar timeframes. If both assets normally move in tandem but begin showing divergence, it could signal a turning point in price.
Example:
Consider the S&P 500 (SPX) and the Nasdaq 100 (NDX). Both typically trend together. If the SPX makes a new high but NDX does not, the strength in SPX may be unsustainable.
Conversely, if EUR/USD makes a lower low but GBP/USD does not, traders may interpret this as a sign of weakening momentum, setting up for a bullish reversal.
This strategy becomes even more powerful when combined with other SMC concepts, such as liquidity grabs, order blocks, and mitigation zones.
Popular Pairs for SMT Divergence Analysis
EUR/USD and GBP/USD: High correlation, ideal for forex divergence signals
SPX and NDX: Often diverge before a trend reversal in equities
Gold (XAU/USD) and Silver (XAG/USD): Metals often diverge during turning points
USD/JPY and DXY (Dollar Index): Useful for understanding dollar-based sentiment
Chart Examples
Example 1: EUR/USD vs GBP/USD (Bullish SMT Divergence)
Let's say EUR/USD makes a new swing low, but GBP/USD holds its previous low. It could indicate selling exhaustion in the euro.
A reversal upward often follows, and confirmation might come via a bullish order block or change of character (CHOCH).
Example 2: S&P 500 vs Nasdaq 100 (Bearish SMT Divergence)
If SPX makes a higher high while NDX lags, the broader market may soon correct. Institutional traders might be using SPX as a trap to induce retail long entries before dropping the market.
Traders can also utilise standard indicator tools such as RSI, trendlines, and price action for additional validation.
How to Trade SMT Divergence: Step-by-Step Guide

Step 1: Identify Two Correlated Markets
Use assets with a high historical correlation. Avoid mismatched pairs, as divergence is meaningful only between tightly connected instruments.
Step 2: Mark Key Liquidity Levels
Look for equal highs and lows or major supply and demand zones on both assets.
Step 3: Look for Divergence
If one asset breaks structure while the other doesn't note the discrepancy. Confirm if the divergence aligns with a liquidity sweep or smart money concept.
Step 4: Combine With Confirmation
Wait for additional signs like:
Step 5: Execute Trade With Risk Management
Place a trade in the direction of the divergence and confirmation signal. Keep stops beyond recent swing points and target the next liquidity pool.
SMT Divergence in Forex Trading
Forex traders frequently use SMT Divergence between pairs such as EUR/USD and GBP/USD or USD/JPY and the DXY.
A common scenario:
This setup often precedes a bullish reversal in both pairs, especially when combined with smart money tools.
SMT Divergence in Indices Trading
In the equities world, the divergence between SPX and NDX is widely used. Divergence at swing highs or lows during earnings seasons or Fed meetings can highlight where smart money is flowing.
For example:
SPX makes a new high post-news
NDX lags and fails to break highs
Within the next session, both begin to fall
This setup reflects possible institutional selling.
Benefits and Risks of SMT Divergence
| Benefits |
Risks / Challenges |
| Offers early signals of potential reversals |
Can produce false signals without proper confluence |
| Enhances trade confirmation with intermarket data |
Requires constant monitoring of two charts |
| Helps identify institutional buying/selling zones |
Not effective with loosely correlated assets |
| Useful across forex, indices, metals, and crypto |
Noise on lower timeframes can create confusion |
| Improves timing when paired with SMC tools |
Needs practice and backtesting for reliability |
Conclusion
In conclusion, SMT Divergence is a powerful tool when integrated into a Smart Money Concept trading strategy. By observing how two correlated instruments diverge, traders can anticipate shifts in market sentiment accordingly.
While it requires careful observation, the rewards can be significant when divergence is combined with other high-probability setups.
Disclaimer: This material is for general information purposes only and is not intended as (and should not be considered to be) financial, investment or other advice on which reliance should be placed. No opinion given in the material constitutes a recommendation by EBC or the author that any particular investment, security, transaction or investment strategy is suitable for any specific person.


