Understanding market structure is key to trading success. Among the most vital tools in a price-action trader's toolkit is the Break of Structure (BOS).
Whether you're analysing forex, equities, or crypto, identifying when the market breaks its previous pattern can reveal whether the trend is continuing or weakening.
In this guide, we'll explain what BOS means, how to identify it accurately, build a strategy around it, and apply risk-conscious tips to trade with confidence.
What Is a Break of Structure (BOS)?
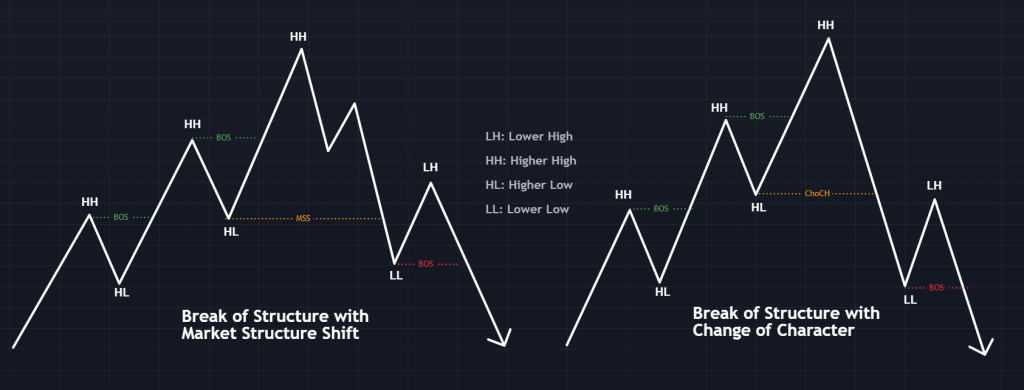
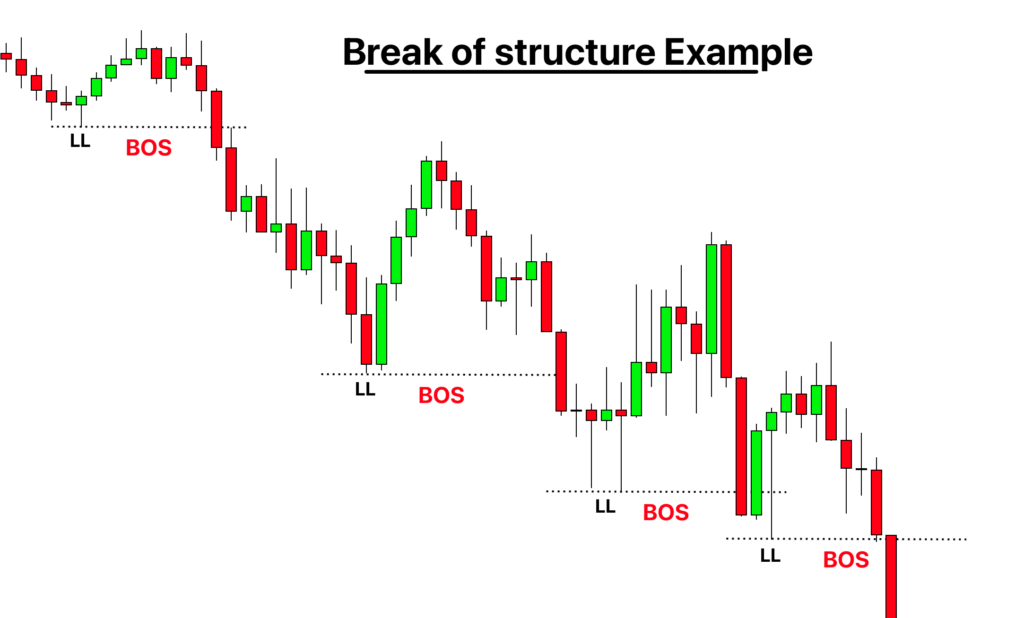
A Break of Structure occurs when price decisively breaks above a recent swing high in an uptrend or below a recent swing low in a downtrend. This breakout signals that the existing trend remains strong and likely to continue.
In an uptrend, a bullish BOS happens when price exceeds the most recent high without first breaking the prior low; conversely, in a downtrend, a bearish BOS is confirmed when price falls below the last low without first breaking the recent high.
BOS is a smart-money idea that illustrates how institutional or liquidity-driven momentum pushes prices outside standard consolidation areas.
How to Identify a BOS Correctly
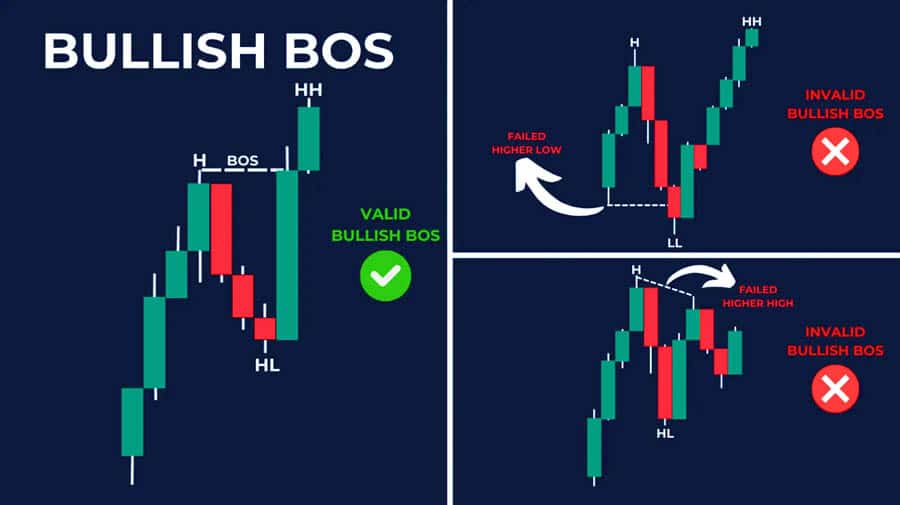
Accurate identification of BOS relies on clean price action and confirmation:
Identify the prevailing trend based on a series of swing highs and lows.
Pinpoint the last significant organic high or low (not minor fluctuations).
Confirm that price closes beyond that swing, preferably using candle bodies rather than wicks.
Avoid false breaks by watching for volume confirmation or retests.
Validate across multiple timeframes: higher timeframe BOS confirms trend, while a lower timeframe retest provides timing cues.
A candle closing above the most recent swing high in an uptrend, without first dipping below the last swing low, confirms a bullish BOS. The broken swing often transforms into a new support zone. The opposite applies for bearish BOS.
Why the Break of Structure Matters in Trading?
Traders use BOS to verify that momentum remains aligned with the existing trend, allowing for improved entry, exit, and risk management. It gives clarity on direction: a bullish BOS suggests a long bias, while a bearish BOS suggests a short bias.
It also helps align trading decisions with institutional flows, those big players who move price by hunting liquidity around swing levels. BOS helps define:
Stop-loss placement around broken swing levels
Potential retracement zones
Valid entry zones after retests
Because BOS is versatile across timeframes, it works effectively for scalpers (lower timeframes), swing traders (4H/daily) and position traders (daily/weekly).
Step-by-Step BOS Trading Strategy
1. Define Trend and Structure
Begin with a higher timeframe (daily or 4-hour) to assess if the market is in a trend. Look for a series of higher highs and higher lows (bullish) or lower highs and lower lows (bearish). Identify swing points and track prior structure.
2. Spot BOS and Mark Levels
When price breaks the recent swing high (in a bullish trend), draw a horizontal line at that level. Wait for a close above. It defines your BOS. For a bearish BOS, do the same below the swing lows.
3. Wait for a Retest
Often, price returns to retest the broken structure level. A successful retest and bounce confirm strength. Use shorter timeframes (H1 or 15-minute) to refine entry points by observing price action signals such as a bullish engulfing pattern near a retest.
4. Enter Trade with Defined Risk
For long trades, enter near the retested structure if the price shows a bullish reversal. Place a stop loss just below the cleaned swing low. For shorts, the opposite approach is used.
5. Set Profit Targets
Use recent swing points, Fibonacci levels, or measured moves. Many traders target the next resistant swing high (for longs) or swing low (for shorts), or use risk-reward ratios of at least 1:2.
6. Confirm with Context Tools
A surge in volume during the breakout, combined with Fibonacci retracement, momentum indicators (RSI, MACD), or broader market context, all enhance the reliability of the signal. Steer clear if there's contradictory news or economic catalysts.
Key Tips & Best Practices
1) Use Multiple Timeframes
Always context-trade BOS. A swing on a daily confirms trend; lower 4H/1H charts offer precise entries. Avoid focusing on low timeframes, which may lack structural relevance.
2) Filter False Breakouts
Look for retests or higher volume confirmation. A wick-through pivot and close-back inside the range often indicates fakeouts.
3) Don't Rely Solely on BOS
Combine BOS with Change of Character (ChoCh), liquidity zones, order blocks, or RSI divergence for stronger setups. Traders using Smart Money Concept frameworks often blend BOS with these elements.
4) Manage Position Size
Wider stop placements may be needed depending on volatility. Use fixed risk per trade (1–2% of capital), and never overleverage.
5) Stay Mindful of News Events
Major data releases can invalidate BOS signals or accelerate momentum beyond expected zones. Avoid trading breakouts before major economic events.
Conclusion
In conclusion, break of structure is a cornerstone of price action and Smart Money trading strategies. Whether you're trading forex, stocks, or crypto, mastering BOS helps you align with institutional momentum, avoid false breakouts, and select cleaner, higher-probability trades.
As always, combine BOS with other tools, practice on historical charts, and commit to consistency. Over time, BOS becomes an indispensable element of your trading edge.
Disclaimer: This material is for general information purposes only and is not intended as (and should not be considered to be) financial, investment or other advice on which reliance should be placed. No opinion given in the material constitutes a recommendation by EBC or the author that any particular investment, security, transaction or investment strategy is suitable for any specific person.


