In technical analysis, traders constantly search for edges—repeatable patterns or inefficiencies in markets that can be exploited with discipline. One concept gaining traction among modern traders is the fair value gap (FVG). This idea is rooted in the observation that markets sometimes move too quickly in one direction, creating areas on the chart where price has not traded efficiently. Traders believe these imbalances are likely to be revisited in the future, creating both opportunity and risk.
This guide takes a comprehensive look at the fair value gap in trading, exploring what it is, why it forms, and how to build strategies around it. By examining evidence from charts, discussing variations such as the inverse fair value gap, and considering practical aspects like risk management and backtesting, we aim to turn theory into a usable framework.
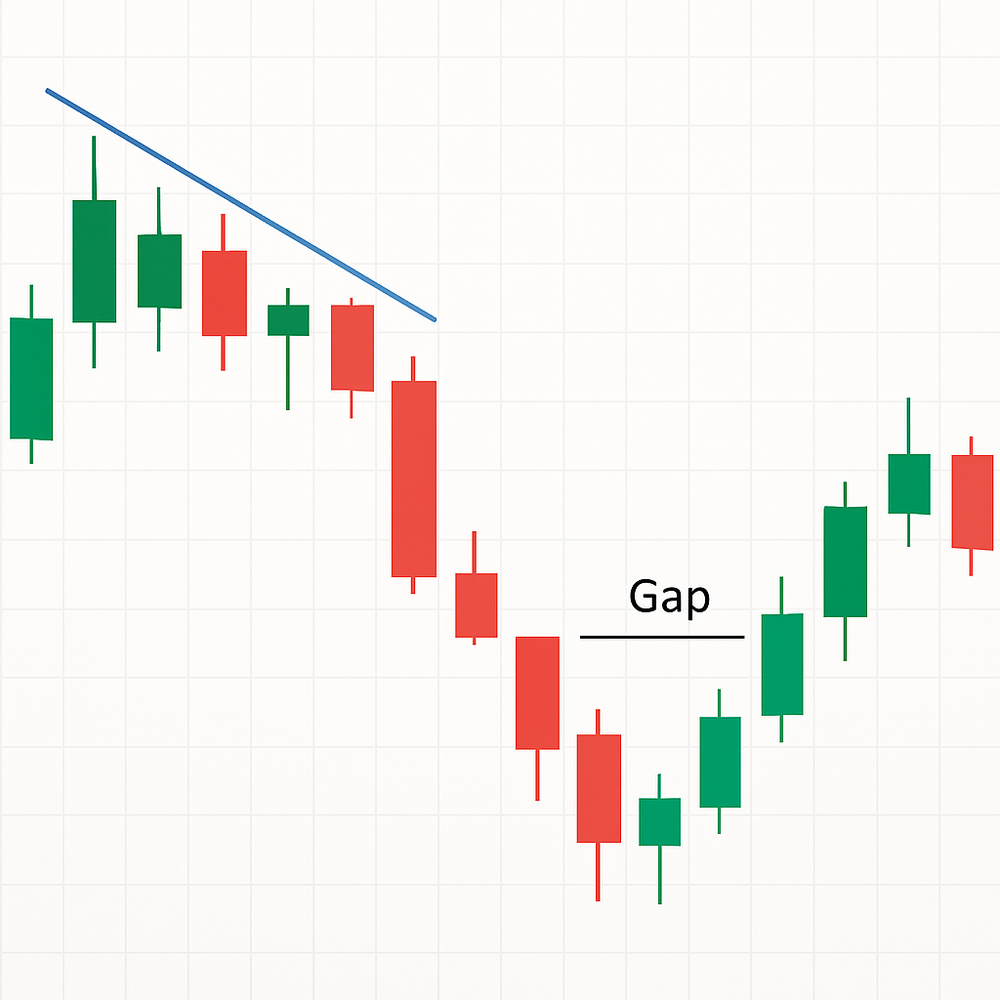
How to Identify a Fair Value Gap on a Chart
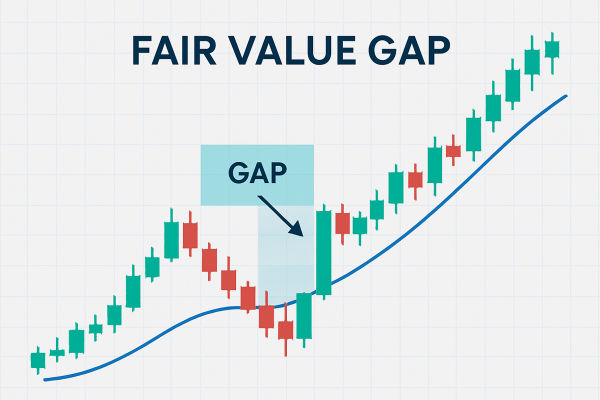
Identifying a fair value gap requires careful observation. Traders typically scan charts for sections where a strong impulse candle disrupts the normal back-and-forth rhythm of price. A valid FVG often features a large candle body with little overlap from its neighbouring candles.
These imbalances are most visible when momentum accelerates, often during major economic announcements, earnings releases, or unexpected news. On smaller timeframes, gaps appear frequently but are less reliable. On larger timeframes such as the four-hour or daily chart, fair value gaps are clearer and more meaningful because they reflect institutional activity rather than retail noise.
Distinguishing Valid Gaps From Noise
Not all gaps are worth trading. A valid fair value gap in trading is one that emerges in the context of strong momentum and has clear, untested space on the chart. Traders must distinguish between genuine imbalances and ordinary fluctuations.
One way to filter is by looking at the size of the move. A tiny gap on a one-minute chart could be the result of low liquidity rather than real imbalance. A pronounced void on a daily chart, however, suggests institutions entered the market aggressively, creating levels worth watching. Aligning the gap with overall trend direction and higher timeframe analysis helps separate signal from noise.
Types of Fair Value Gaps
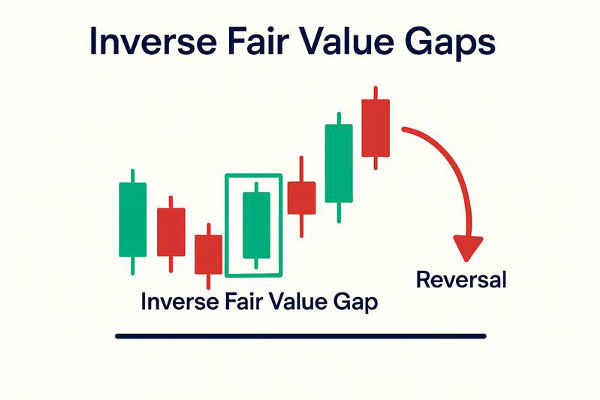
Fair value gaps do not all behave the same way. The most common type is the standard FVG, created when price surges strongly and leaves a clear imbalance. Another important variation is the inverse fair value gap, which forms against the prevailing trend and sometimes signals counter-moves.
Other gaps can be contextual. Continuation gaps appear within strong trends and act like zones of support or resistance when revisited. Exhaustion gaps occur near the end of trends and can foreshadow reversals. Recognising which type of FVG you are observing allows traders to set realistic expectations about whether the market will treat it as a launchpad or a turning point.
Are FVGs the Same as Order Blocks or Liquidity Voids?
Traders often confuse fair value gaps with order blocks or liquidity voids. Although related, they are distinct concepts. An order block represents a cluster of institutional orders usually found at key turning points. A liquidity void refers to any thinly traded area with low participation, which can include FVGs but is broader in scope. A fair value gap is a specific three-candle structure that marks inefficiency.
Understanding these distinctions matters because while all three ideas relate to imbalances, their trading implications differ. FVGs are generally seen as magnets where price is likely to return, while order blocks are zones of supply and demand, and liquidity voids are broader weaknesses in order flow.
Best Timeframes and Assets for Trading FVGs
Fair value gaps appear on all timeframes and across all asset classes, but not all are equally reliable. Higher timeframes such as the one-hour, four-hour, and daily charts filter out much of the noise that plagues lower charts. FVGs formed on these charts are more likely to be respected because they represent institutional positioning.
Liquid assets such as major forex pairs, gold, oil, and equity indices tend to produce the most reliable fair value gaps. These markets attract significant institutional activity, which means imbalances left behind are more likely to be revisited. In thinly traded markets, gaps may simply reflect erratic order flow and provide unreliable signals.
FVGs Across Different Market Regimes
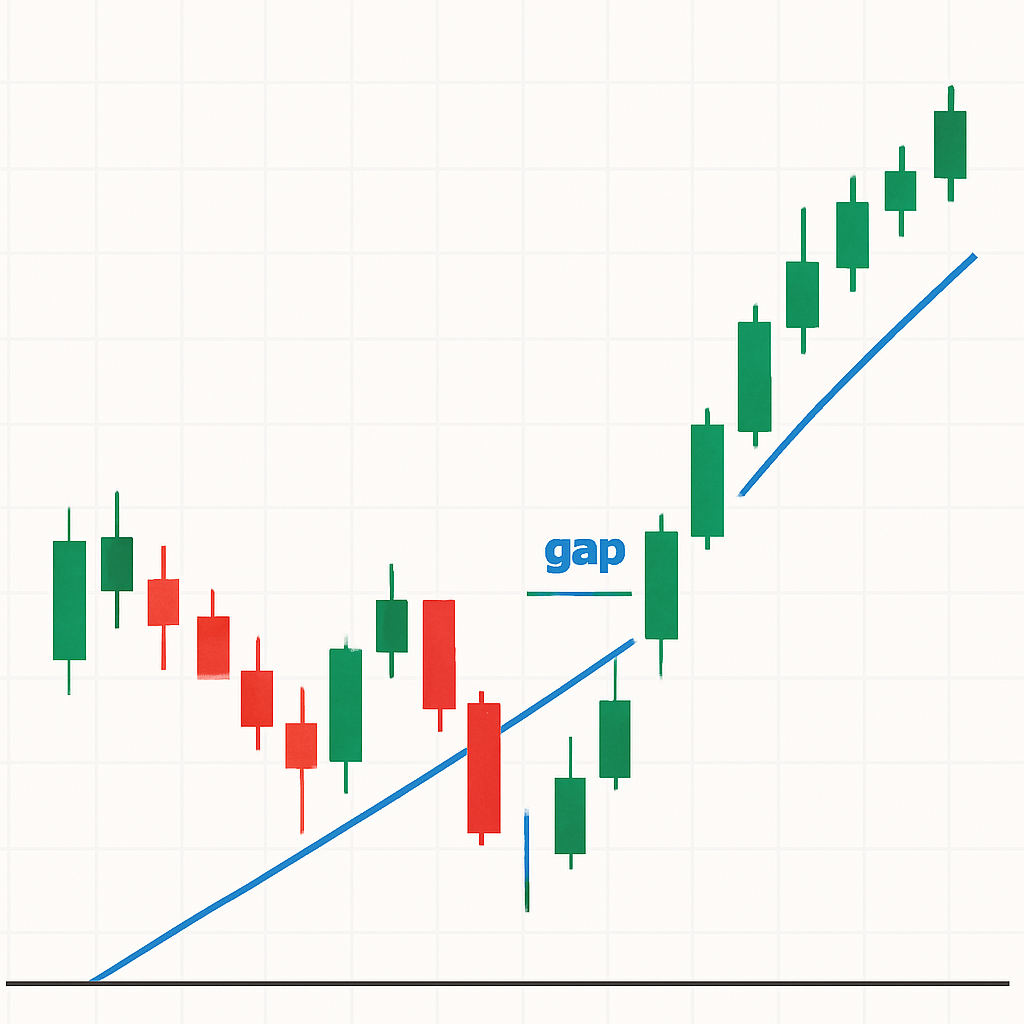
Market regime plays a big role in how fair value gaps behave. In strong trending environments, FVGs often act as continuation signals. Price may retrace partially into the gap before resuming the dominant trend. In ranging markets, however, FVGs may fill quickly but fail to produce meaningful follow-through, creating opportunities for shorter-term trades but limiting sustained profits.
Understanding the regime allows traders to adapt expectations. During trending periods such as gold’s rally in 2020–2021, bullish FVGs frequently produced strong continuations. During sideways markets, gaps still filled but often lacked momentum afterward.
Conclusion
The fair value gap in trading is more than just a pattern; it reflects moments when markets move with such urgency that efficiency is temporarily lost. Traders use these imbalances as reference points, anticipating that price will eventually revisit them. By learning to identify valid gaps, filtering them through context, and trading them with disciplined risk management, FVGs can become powerful components of a technical strategy.
Whether viewed as continuation signals in trends or short-term opportunities in ranges, fair value gaps highlight how market inefficiencies can be transformed into trading edges. Like all tools, they are not infallible. Success comes from combining them with broader analysis, consistent backtesting, and strict discipline.
Fair value gaps remind us of a core trading truth: markets are never perfectly efficient. By recognising where inefficiencies exist, disciplined traders can turn volatility into structured opportunity.
FAQs About Fair Value Gaps
1. What is the main advantage of trading fair value gaps?
They provide clear, visually identifiable levels that often act as magnets for price, offering structured entry and exit points.
2. Are fair value gaps guaranteed to fill?
No. Some gaps remain open for weeks or months, and others only fill partially. They are probabilities, not certainties.
3. Can fair value gaps be combined with other strategies?
Yes. Many traders combine them with Fibonacci retracements, order blocks, or moving averages for higher accuracy.
Disclaimer: This material is for general information purposes only and is not intended as (and should not be considered to be) financial, investment, or other advice on which reliance should be placed. No opinion given in the material constitutes a recommendation by the author that any particular investment, security, transaction or investment strategy is suitable for any specific person.
