Published on: 2025-12-11
Updated on: 2025-12-11
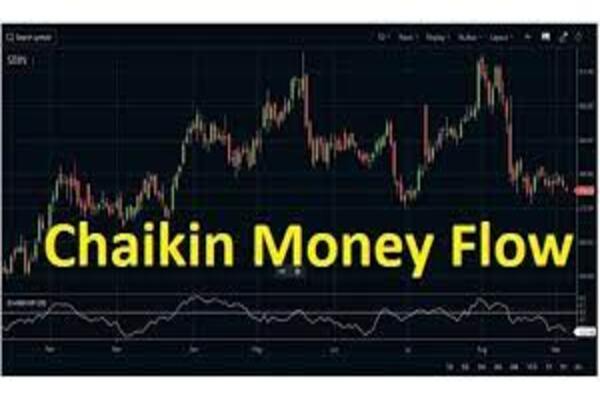
Chaikin Money Flow, often called CMF, is a technical indicator that shows whether money is moving into or out of a market. It combines price and volume to estimate buying and selling pressure. When CMF is above zero, buyers tend to dominate.
When it is below zero, sellers tend to dominate. Traders care about CMF because it helps confirm trends, spot weakening moves, and identify points where demand or supply may be shifting.
In trading, CMF measures how often price closes near the high or low of the period and how much volume comes with it. Closes near the high with strong volume point to buying pressure. Closes near the low with strong volume point to selling pressure.
The indicator sums these values over a set number of periods, often 20 or 21, then divides by total volume.
Traders see CMF on most charting platforms as a line that moves above or below zero. Short term and medium term traders use it most. It helps confirm breakouts, trends, and reversals. It is also useful for spotting divergence when price makes new highs or lows but the money flow does not match.
CMF uses the money flow multiplier and money flow volume over N periods.

A positive CMF means buying pressure. A negative CMF means selling pressure.
Several forces can shift CMF readings:
Price position inside the candle. When price closes near the high, CMF tends to rise. Closing near the low makes it fall.
Volume levels. Heavy volume makes each candle’s impact stronger. Light volume reduces the meaning of price moves.
Trend strength. Healthy uptrends often keep CMF above zero. Strong downtrends often keep it below zero.
News events. Data releases can cause sharp moves with high volume, which can swing CMF quickly.
False spikes. Short bursts of volume with no follow-through can create short term jumps in the indicator.

CMF can help with timing by confirming whether a move has real support. When CMF is strong and positive, long entries may have better follow-through. When CMF is weak or negative, long trades may face resistance.
For exits, fading CMF can warn that a trend is losing strength. It can also help traders avoid taking trades in markets where volume does not support the price direction.
High CMF readings with a rising trend can signal better trade conditions. Deep negative readings during a downtrend can support short setups. Mixed or unstable readings often mean higher risk.
CMF above zero during an uptrend.
CMF rising before a breakout.
CMF showing positive divergence in a downtrend.
CMF falling while price rises.
CMF stuck near zero with no clear direction.
CMF flips quickly due to thin volume.
Suppose an asset trades with a high of 105, a low of 95, and a close of 103 on a day when volume is 1 million units. The close is near the top of the range. To find the money flow multiplier for this candle:

This means 60 percent of that day’s volume counts as positive money flow. If this value stays high for several days and volume remains strong, CMF will likely move above zero. A trader may view this as healthy buying pressure that supports long positions.
If the close were near the low, the multiplier would be negative and would pull CMF lower.
Look at whether CMF is above or below zero. Above zero signals buying pressure.
Compare CMF with recent highs and lows. Rising CMF with rising prices can support trend trades.
Watch for divergence. If price makes a new high but CMF does not, demand may be weakening.
Check the volume pattern. CMF works best when volume is stable or rising.
Look at the lookback setting. Short settings move faster, long settings give smoother signals.
Tip: Review CMF at least once per session and whenever a setup forms near a key level.
Using CMF alone to enter trades. It is a confirmation tool, not a stand-alone system.
Ignoring low volume periods. CMF loses meaning when volume dries up.
Forcing signals during ranges. In sideways markets, CMF can sit near zero and offer little insight.
Not checking for divergence. Many traders miss early warnings when CMF disagrees with price.
Switching settings too often. Constant changes can make readings inconsistent.
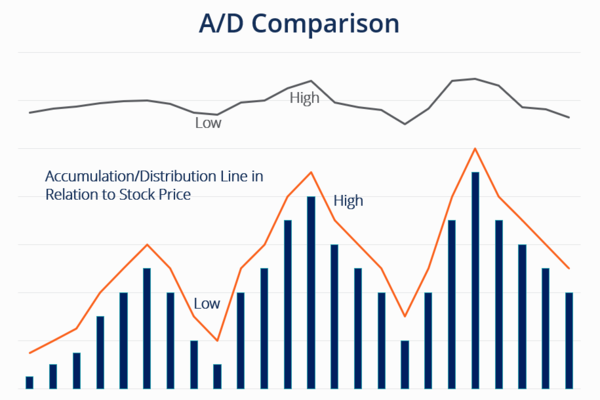
Accumulation Distribution Line: CMF builds on this concept using volume and price location.
On Balance Volume: also tracks volume pressure, but with a different method.
Volume Profile: shows where trading activity is concentrated.
Relative Strength Index (RSI): helpful for spotting divergences alongside CMF.
MACD: often paired with CMF for trend confirmation.
Breakout setups: work better when CMF rises before the move.
It means buying pressure has been steady. Price often closes in the upper part of each candle, and enough volume supports those moves. This does not promise a trend, but it shows demand has been stronger than supply over that time.
This is called divergence. It happens when price makes a new high or low but the buying or selling pressure does not match it. This can warn that a trend may be slowing or that a breakout may not be strong.
CMF measures how price and volume move together. When volume is steady, the signals are clearer. When volume is thin, even small trades can distort the indicator, which can lead to weak or misleading signals.
No. A negative value only shows selling pressure has been stronger during the selected period. Prices can still move up, but those moves may have less support. It is a sign to look more closely at trend strength and key levels.
Yes. When CMF rises before or during a breakout, it shows that volume is supporting the move. When CMF stays weak during a breakout, the move may struggle to continue.
Yes. CMF is easy to read. Above zero suggests buyers are stronger, and below zero suggests sellers are stronger. It helps beginners understand how volume supports price, which is a basic skill in trading.
Chaikin Money Flow shows whether real trading volume supports the direction of price. It reads how strongly buyers or sellers are influencing the market.
Used with key levels and trend tools, it can confirm stronger moves and warn when momentum weakens. Used alone or in thin markets, it can give unclear signals.
Disclaimer: This material is for general information purposes only and is not intended as (and should not be considered to be) financial, investment or other advice on which reliance should be placed. No opinion given in the material constitutes a recommendation by EBC or the author that any particular investment, security, transaction or investment strategy is suitable for any specific person.


World's Best Broker