Published on: 2025-12-11
Updated on: 2026-08-05
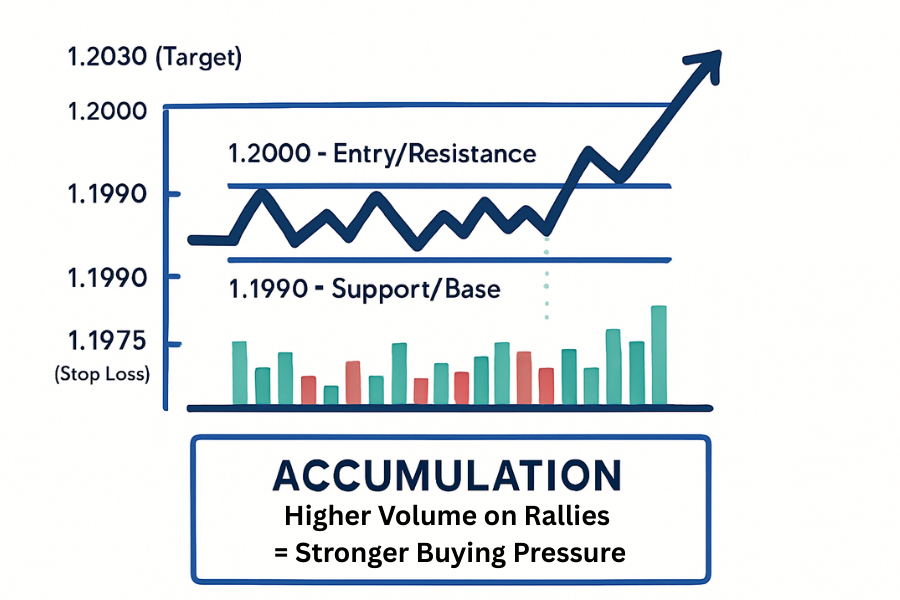
Accumulation is the quiet part of a market cycle. It describes a stretch of time when large buyers build positions little by little inside a price range, without pushing the price up very much.
They buy in small pieces on purpose. A big buyer who fills an entire order at once moves the price against themselves and pays more for the rest. Spreading it over days or weeks keeps the price calm and the average cost lower. On a chart this looks uneventful: price drifts sideways, the lows keep holding, and volume runs heavier on up days than down days.
One thing to sort out first. Traders use “accumulation” in three different ways, and the meanings often get blended together. This guide separates them, covers the Wyckoff structure and the indicator math, and explains why forex makes accumulation harder to read than stocks.
Accumulation means buying pressure building while price stays flat. Distribution is the same idea at the top of a move.
In the Wyckoff method, accumulation runs through five phases, labelled A to E.
The Accumulation/Distribution Line is separate: a volume indicator created by Marc Chaikin.
You can only be certain a range was accumulation after it ends. Plenty of quiet ranges break downward.
1. Wyckoff accumulation. The structured trading range described by Richard Wyckoff in the 1930s, where selling pressure gets absorbed before a new uptrend begins. This is the meaning most people want when they search the term, and it follows a specific sequence of stages. For the full breakdown, see a dedicated guide to the Wyckoff accumulation phases and how traders read them.
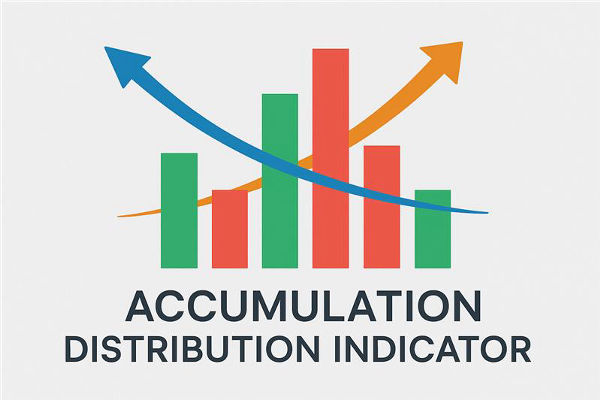
2. The Accumulation/Distribution Line, or A/D Line. An indicator, not a market phase. It measures where each bar closed within its own high-to-low range and weights that by volume. Because it is math applied bar by bar, it can read positive even while price falls.
3. “Smart money” accumulation. The looser everyday usage: any large participant quietly building a position. Albert Kyle’s 1985 model in Econometrica explains why. Concentrated buying gives the information away and raises the cost of everything bought afterwards (Kyle, 1985).
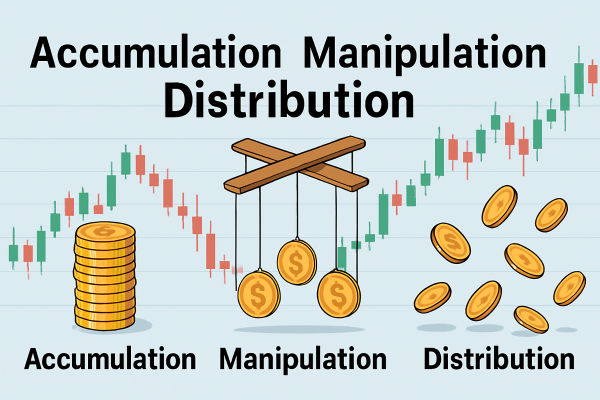
Wyckoff treated accumulation as a sequence rather than a single event, splitting it into five phases with named moments traders learn to recognise in order.
Phase |
What is happening |
Named events |
A |
Selling slows and the decline stops |
Preliminary Support (PS), Selling Climax (SC), Automatic Rally (AR), Secondary Test (ST) |
B |
The range settles in and supply gets absorbed |
Repeated tests of the floor and ceiling |
C |
A last test of supply, often a false breakdown that closes back inside |
Spring, Test |
D |
Demand takes control while price is still in the range |
Sign of Strength (SOS), Last Point of Support (LPS) |
E |
Price leaves the range and trends higher |
Markup |
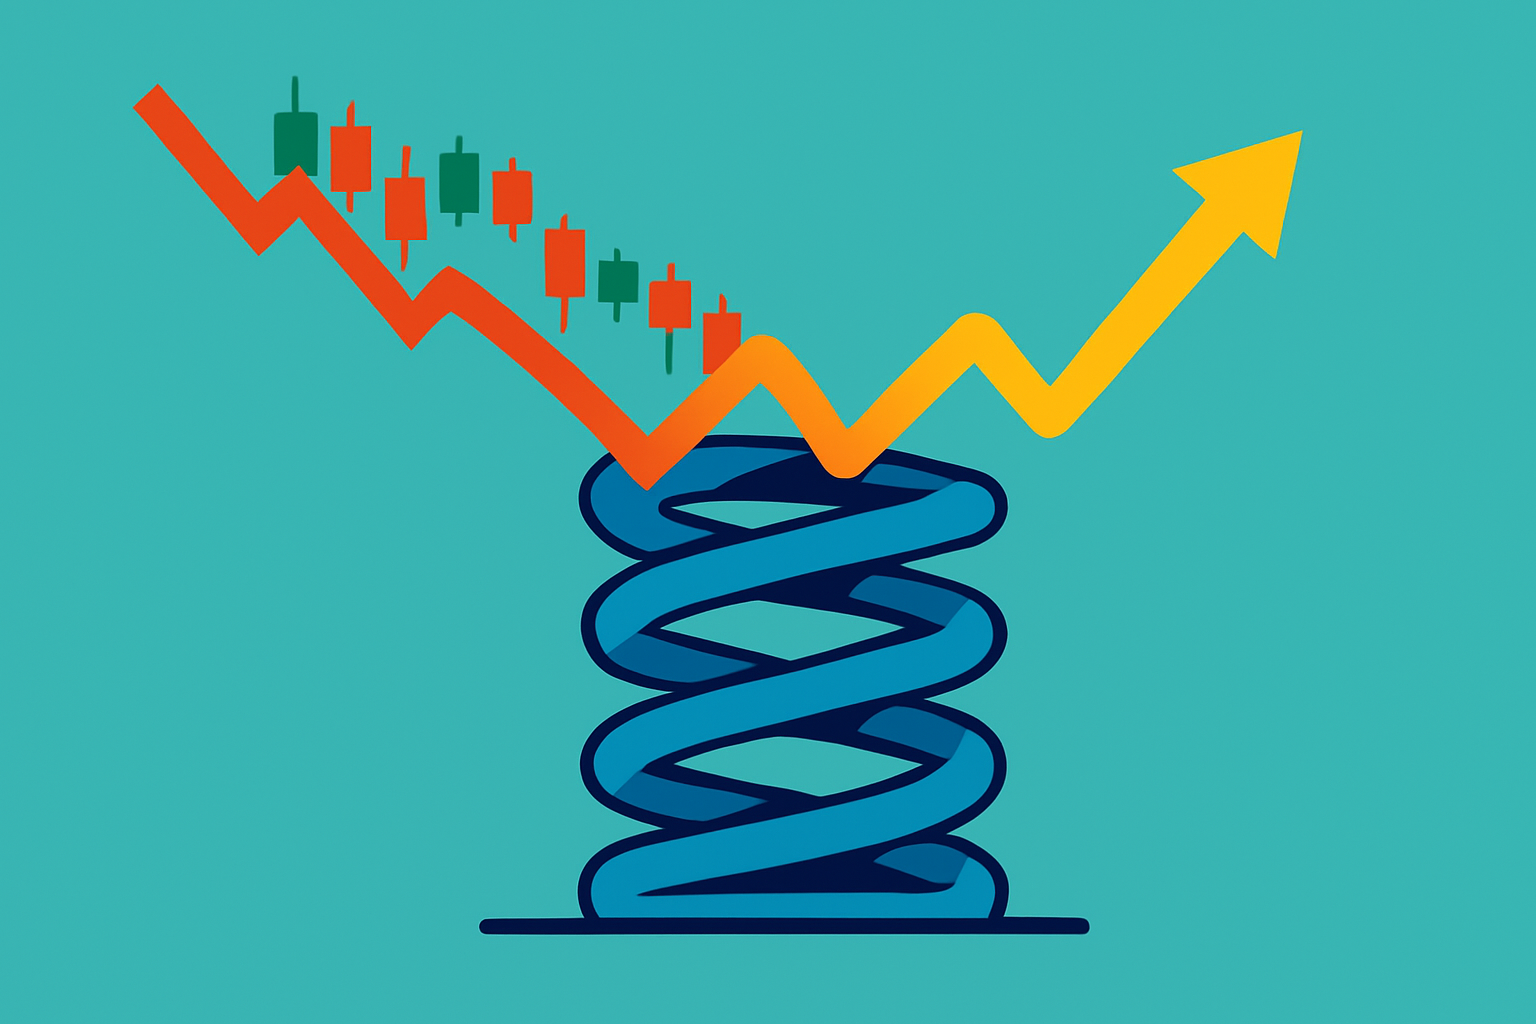
The spring in Phase C is the moment most traders watch for. Price slips below the range low, sell orders resting there get triggered, then price recovers back inside on lighter volume. Smart money traders call much the same behaviour a liquidity sweep below an obvious level. A spring is common but not required, and some ranges go straight from Phase B into Phase D.
The idea is simple. If a bar closes near its high, buyers likely won that session. If it closes near its low, sellers did. The indicator scores that position, multiplies it by volume, and adds the result to a running total.
The calculation, done for every bar:
Money Flow Multiplier = ((Close − Low) − (High − Close)) / (High − Low)
Money Flow Volume = Multiplier × the bar’s volume
A/D Line = previous A/D value + Money Flow Volume
The multiplier always lands between −1 and +1. A close at the top of the bar gives +1, a close at the bottom gives −1, and a close at the midpoint gives 0. Traders read the finished line as confirmation when it climbs alongside price, and as divergence when the two pull apart.
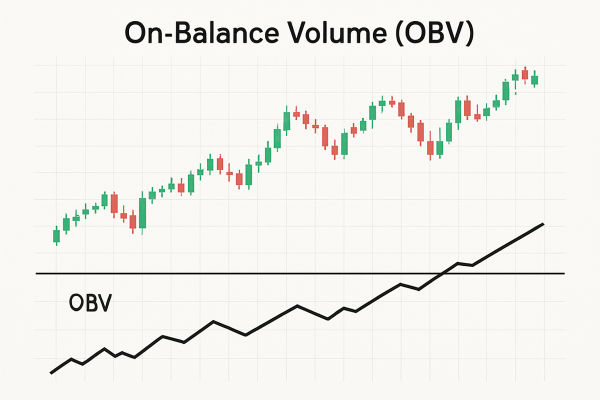
One limitation matters before you rely on it. The formula only looks inside a single bar, so it ignores gaps between periods. A market can gap sharply lower, and the A/D Line will still rise, as long as that day closes in the upper half of its own range. On-Balance Volume would fall instead, because OBV compares each close to the previous close. Chaikin Money Flow uses the same math but sums it over 20 or 21 periods, making it a bounded oscillator rather than a running total. For settings and examples, see the walkthrough of the A/D indicator.
Five conditions usually appear together:
A downtrend that has clearly run its course before the range begins.
A sideways range with a floor that keeps holding when tested. This is ordinary support and resistance behaviour, and the range can be traded with range-bound methods.
Individual bars shrinking as the range matures, so volatility quietly contracts.
Volume running heavier on up moves than down moves inside the range.
Failed breakdowns, where price dips below the floor and closes back above it within a bar or two.
One caveat matters more than the signs themselves. None of them confirms accumulation while it is happening. A range can show all five and still break downward. Confirmation only arrives once price leaves the range on expanding volume and holds above the old ceiling. Calling a range accumulation before that is a forecast, not an observation.
Spot forex has no central exchange and no single record of what was traded, so there is no true volume figure. The Bank for International Settlements measures the market every three years by surveying dealers. Its 2025 Triennial Survey, published September 30, 2025, put global FX turnover at $9.6 trillion per day in April 2025, up 28% from April 2022, with the US dollar on one side of 89.2% of all trades. Useful context, but a snapshot rather than something you can read on a chart.
What MT4 and MT5 show as “volume” on a spot pair is tick volume: the number of price updates inside that bar, not contracts traded. It generally moves in step with real activity, so it works as a proxy, but it is not a measurement and varies between liquidity providers. Volume-based accumulation readings on the MetaTrader 5 platform are relative to that particular feed.
Two centralised datasets help fill the gap:
CME Group currency futures. Exchange-reported volume and open interest for the major pairs, published daily.
CFTC Commitments of Traders. Weekly positioning by trader category, released each Friday at 3:30 p.m. Eastern Time and reflecting positions as of the previous Tuesday. The Traders in Financial Futures version separates dealers, asset managers, and leveraged funds (CFTC reports).
Neither shows spot activity. Both give a dated, official view of how large futures participants shifted, which sits closer to the original idea behind accumulation than a tick count does.
The two are mirror images, which makes them easier to learn side by side.
Accumulation |
Distribution |
|
Where it appears |
After a downtrend |
After an uptrend |
What large participants do |
Absorb supply |
Release inventory |
Range behavior |
Floor holds, ceiling breaks |
Ceiling holds, floor breaks |
Wyckoff events |
SC, AR, ST, Spring, SOS, LPS |
Buying Climax, AR, UTAD, SOW, LPSY |
How it resolves |
Markup |
Markdown |
Distribution has its own sequence and its own trap event, the upthrust after distribution. EBC’s guide to Wyckoff distribution covers those phases.
It is read as bullish, since it describes buying that soaks up supply ahead of an advance. The reading only becomes reliable once price leaves the range upward and holds.
Accumulation, markup, distribution, and markdown. The five lettered phases sit inside the accumulation stage, and again inside the distribution stage.
Consolidation means any sideways range, including one inside a trend. Accumulation is a specific claim about who is buying and why, applied to a range that follows a decline.
Yes, though the volume input changes. Price structure carries over unchanged. Volume tools rely on tick volume for spot pairs, so many traders cross-check against CME futures volume or CFTC positioning data.
Accumulation is a strong description and a weak prediction. It tells you what a range would mean if it resolves upward, not whether it will. That is why it works best paired with a level that would prove the idea wrong, usually the range floor or the low of the spring.
Treat it as one piece of technical analysis alongside trend, market structure, and volume. Read on its own, a quiet sideways market is just a quiet sideways market.
Disclaimer: This material is for general information purposes only and is not intended as (and should not be considered to be) financial, investment or other advice on which reliance should be placed. No opinion given in the material constitutes a recommendation by EBC or the author that any particular investment, security, transaction or investment strategy is suitable for any specific person.



World's Best Broker