Published on: 2025-12-12
Updated on: 2025-12-12
The Commodity Channel Index, or CCI, is a technical indicator that shows when market prices move far above or below their recent average.
It helps traders see if a price is running hot or cooling off. CCI matters because it gives early clues about changing momentum, so traders can judge whether a trend may continue or slow down.
When used with clear rules, it helps traders filter noise, manage timing, and avoid emotional entries.
CCI is a momentum oscillator that compares the current price to its average price over a set number of periods, often 14. It turns this comparison into a number. Readings above zero show price sitting above its average. Readings below zero show the opposite.
Traders often watch levels around +100 and minus 100 because these levels can mark strong shifts in buying or selling pressure.
 You will see CCI inside most charting platforms. It appears as a separate window under the price chart. Intraday traders, swing traders, and trend followers use it to confirm strength or weakness.
Many traders pair CCI with price action tools such as support, resistance, or moving averages. It is most helpful when markets set clear trends but can also highlight exhaustion near range boundaries.
The CCI moves for simple reasons tied to how price behaves.
When price climbs sharply, CCI rises because the market sits far above its recent average. When price drops quickly, CCI falls for the same reason.
Fast candles raise or lower the reading more than slow candles. When markets speed up, CCI swings harder.
If the average price climbs, it takes more upward pressure to push CCI higher. If the average falls, downward pressure moves CCI lower more easily.
When price stabilizes or moves sideways, CCI tends to drift toward zero because price stays close to its average.
CCI influences entries and exits because it shows whether a move has strength behind it. When CCI crosses above +100, it may confirm a strong upward push. Some traders buy only when this strength lines up with a trend.
 When the reading slips back below +100, they may treat it as a warning sign. The same logic applies when CCI falls below minus 100 in a downtrend.
CCI also plays a role in managing risk. When the indicator swings too quickly, spreads can widen and slippage can increase. A trader who pays attention to CCI can avoid entering at stretched points when the market feels unstable.
Good situation: CCI lines up with the trend, readings move smoothly, and signals are not too crowded.
Bad situation: CCI whipsaws around zero, gives many false breaks, or moves too far outside typical ranges during news.
Suppose a pair trades around 1.1000 and the 14-period average sits at 1.0995. The price suddenly jumps to 1.1020. This is a clear move above the average, so CCI may rise above +100. A trend trader sees this as confirmation and enters long with a small position.
Later, price rests near 1.1012.

Because this level is closer to the average, CCI falls back toward +60. The trader now faces a choice. If CCI breaks back under +100 and keeps slipping, it can hint that momentum is weakening.
If the trader exits at 1.1012 instead of waiting for a deep pullback, the gains remain intact. This example shows how CCI helps a trader judge strength, not predict exact highs or lows.
Use a short checklist before making a decision.
Open your chart and confirm the CCI period, often 14 days.
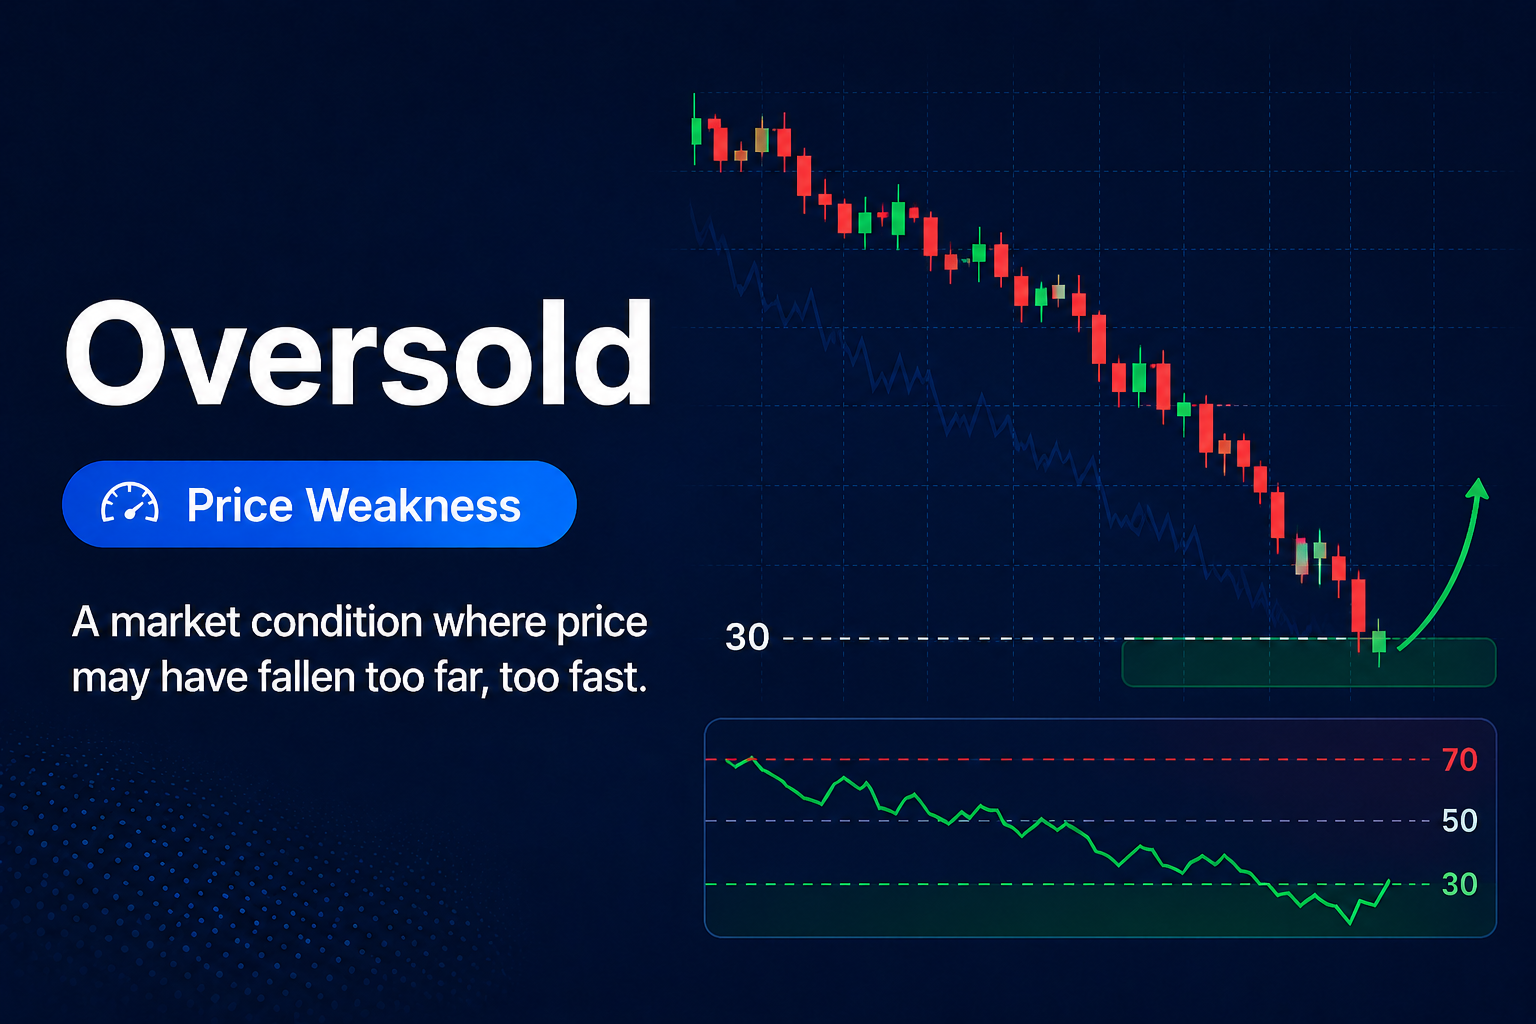
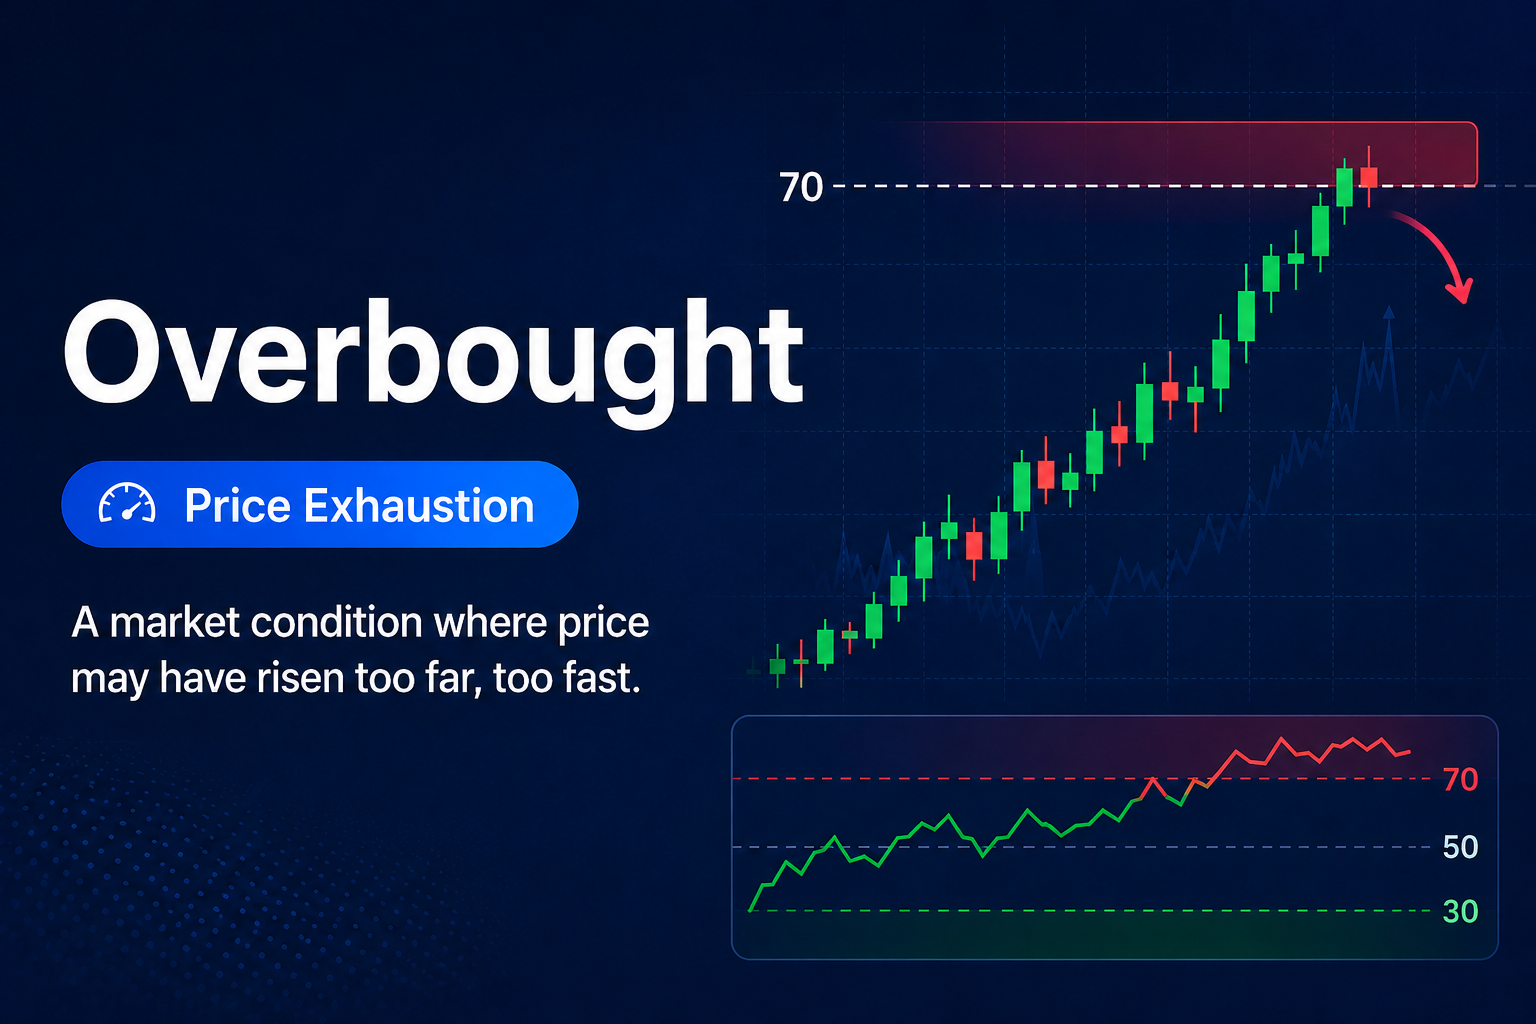
Look at today’s reading. Values near zero show calm conditions. Values above +100 or below minus 100 show stretched conditions.
Compare the reading with the trend direction on the chart.
Notice if CCI is rising, falling, or flattening.
Check whether news is scheduled because CCI becomes less stable around releases.
A quick habit is to scan CCI on several timeframes once each hour during active sessions.
Treating every +100 or minus 100 break as a trade. These levels show strength, not a guarantee of continuation.
Using CCI alone. Without price levels or a trend check, signals become guesswork.
Ignoring market conditions. In choppy markets CCI whipsaws, which creates noise.
Switching settings too often. Constant changes make it hard to learn how CCI behaves.
Forcing reversals. Extreme readings can stay extreme in strong trends, so early countertrend trades can fail.
RSI: Another momentum indicator that highlights overbought and oversold areas.
Stochastic Oscillator: Tracks where price sits within its recent range.
Moving Averages: Help define trend direction so CCI signals make more sense.
MACD: Shows momentum through moving average differences.
Yes, many beginners find CCI easy to read because it uses clear levels such as +100 and minus 100. It helps new traders understand when price is stretched compared with its recent average. The key is to use it with simple trend checks instead of treating each signal as a trade on its own.
Not always. A reading above +100 mainly shows strong upward momentum, not that the move must reverse. In a healthy trend, CCI can stay above +100 for long periods, so the context of the trend and price structure matters more than the number alone.
Ranges keep price close to its average, so even small moves can push CCI above or below key levels. These moves often fade quickly because the market has no clear direction. Traders usually wait for trend confirmation or combine CCI with support and resistance levels to reduce noise.
The classic setting is 14 periods, which balances sensitivity and stability. Shorter settings react faster but can create more noise, while longer settings smooth signals but react later. The best approach is to stick with one setting long enough to understand how it behaves in different market conditions.
The Commodity Channel Index shows how far price sits from its recent average and helps traders read momentum strength. When used with trend checks and clear price levels, it guides entries and exits with more confidence.
Traders should avoid acting on every extreme reading and focus instead on how CCI behaves within the broader chart picture.
Disclaimer: This material is for general information purposes only and is not intended as (and should not be considered to be) financial, investment or other advice on which reliance should be placed. No opinion given in the material constitutes a recommendation by EBC or the author that any particular investment, security, transaction or investment strategy is suitable for any specific person.


World's Best Broker