Spot XNGUSD is trading around $4.295 per MMBtu, near the top of its 52-week range of $2.62–$4.90.
Where XNGUSD Stands Right Now
Over the past month, XNGUSD has jumped more than 30%, drawing renewed attention from macro and retail traders. U.S. natural gas front-month futures are now trading in the mid-$4s, levels last seen during the early volatility of the Ukraine war.
This surge surpasses the Energy Information Administration’s (EIA) winter forecast near the high-$3s, indicating the market is already pricing in a winter demand and LNG export risk premium.
On the supply side, working gas in storage stands at roughly 3,960 Bcf, about 5% above the five-year average and flat versus last year. While injections remain slightly above seasonal norms, providing a buffer, the market isn’t oversupplied.
Though, any extended cold into January-February could still trigger sharp squeezes.
The Macro Winter Story: Weather, Storage and LNG
La Niña and the 2025-26 Winter Pattern
NOAA’s Climate Prediction Center has confirmed La Niña conditions and expects them to persist into the Northern Hemisphere winter.
The seasonal outlook calls for warmer-than-average temperatures across much of the southern U.S. and the East Coast, with cooler odds tilted towards the Pacific Northwest, Northern Plains and parts of the Great Lakes.
For gas, that mix is tricky. Warmer conditions in the populous southern and eastern states can trim heating demand, but cooler patterns in the northern tier and Plains support strong regional consumption, especially if the polar jet delivers occasional Arctic shots.
Local forecasts around major cities such as Washington D.C. already point to a chillier-than-average winter, even if snowfall is not extreme.
In simple terms: the base case is not a “mega-cold” winter, but it is also not obviously warm across the board. That keeps a real risk of cold spells and price spikes, especially if traders are leaning short into any early-season warmth.
Storage and Supply: A Cushion, Not a Wall
EIA’s latest storage data shows working gas stocks about 5% above the five-year norm, with recent weekly injections beating the seasonal average. This points to a healthy buffer going into winter, and explains why we haven’t seen a blow-off move above $5 yet.
However, EIA’s Short-Term Energy Outlook and independent forecasters still expect U.S. dry gas production around 107 Bcf/d in 2025, with growth slowing slightly afterwards.
Efficiency gains have kept output high despite reduced drilling, but that also means there’s less “slack” if producers react to low prices by cutting activity for too long.
In short: storage is comfortable today, but production growth is not limitless. A run of cold weeks paired with stronger-than-expected exports could tighten balances quickly.
LNG Exports and Structural Demand
The big difference between today’s gas market and pre-2020 is LNG. U.S. LNG exports are running at or near record levels, with dozens of cargoes leaving Gulf Coast terminals in a single week.
EIA expects LNG exports to grow around 25% in 2025 and another 10% in 2026 as new projects ramp up, such as Golden Pass, Corpus Christi Stage 3 and Plaquemines.
That adds steady pull on U.S. gas even if domestic heating demand is modest.
On top of this, medium-term demand from data centres and electrification trends could push power-sector gas burn higher over the next decade, with some estimates seeing data centres alone consuming several Bcf/d by 2030.
For XNGUSD, this means winter price dips are less likely to collapse back to the ultra-cheap levels of early 2024 without a clear supply or policy shock as the floor is rising slowly.
Technical Picture: Multi-Timeframe Analysis
Weekly Chart: From Base to Uptrend
On the weekly timeframe, XNGUSD has lifted out of its long base below $3, clearing the $3.00–$3.20 congestion zone and advancing into the upper end of its 52-week range.
This turn from sideways to trending means old resistance is now first-line support. The key weekly zones are:
$3.00–$3.20: Old base and psychological level, prior floor after the 2022–23 washout.
$3.50–$3.80: Mid-range balance area where price hesitated in 2025; likely a strong “buy-the-dip” zone if tested.
$4.70–$4.90: Region of 52-week highs and a likely heavy volume shelf from recent trade near the top.
With price pushing above $4.50, XNGUSD is almost certainly holding above both its 200-week and 200-day moving averages, signaling a decisive shift from an oversupplied market toward a more balanced-to-tight structure that is consistent with its sustained rally off sub-$3 levels.
Daily Chart: Winter 2025–26 Key Levels

Zooming into the daily chart, the structure shows a sequence of higher highs and higher lows from the early-2025 lows near $2.6 up to the current $4.5 region. The recent leg higher from ~$3.50 has been steep, so some cooling should be expected.
Important daily levels going into winter:
Immediate resistance: $4.70–$4.90
This band marks recent swing highs and the top of the 52-week range. A clean daily close above $4.90 would open the door to a psychological tag of $5.20–$5.50.
First support: $4.10–$4.20
This zone lines up with the last breakout area and a likely volume shelf where late shorts were squeezed. A pullback here that holds on a daily closing basis would keep the uptrend intact.
Deeper support: $3.80 and $3.50
$3.80 marks the prior consolidation ceiling, while $3.50 is a key swing low and probable Fib cluster area versus the 2025 high. A weekly close below $3.50 would be the first real warning that the winter bull run is failing.
From a momentum lens, the daily RSI is likely coming off overbought territory after the recent sprint above $4.5, while MACD remains positive but is prone to flatten on any sideways consolidation.
Intraday (4H): Trader Levels and Volatility
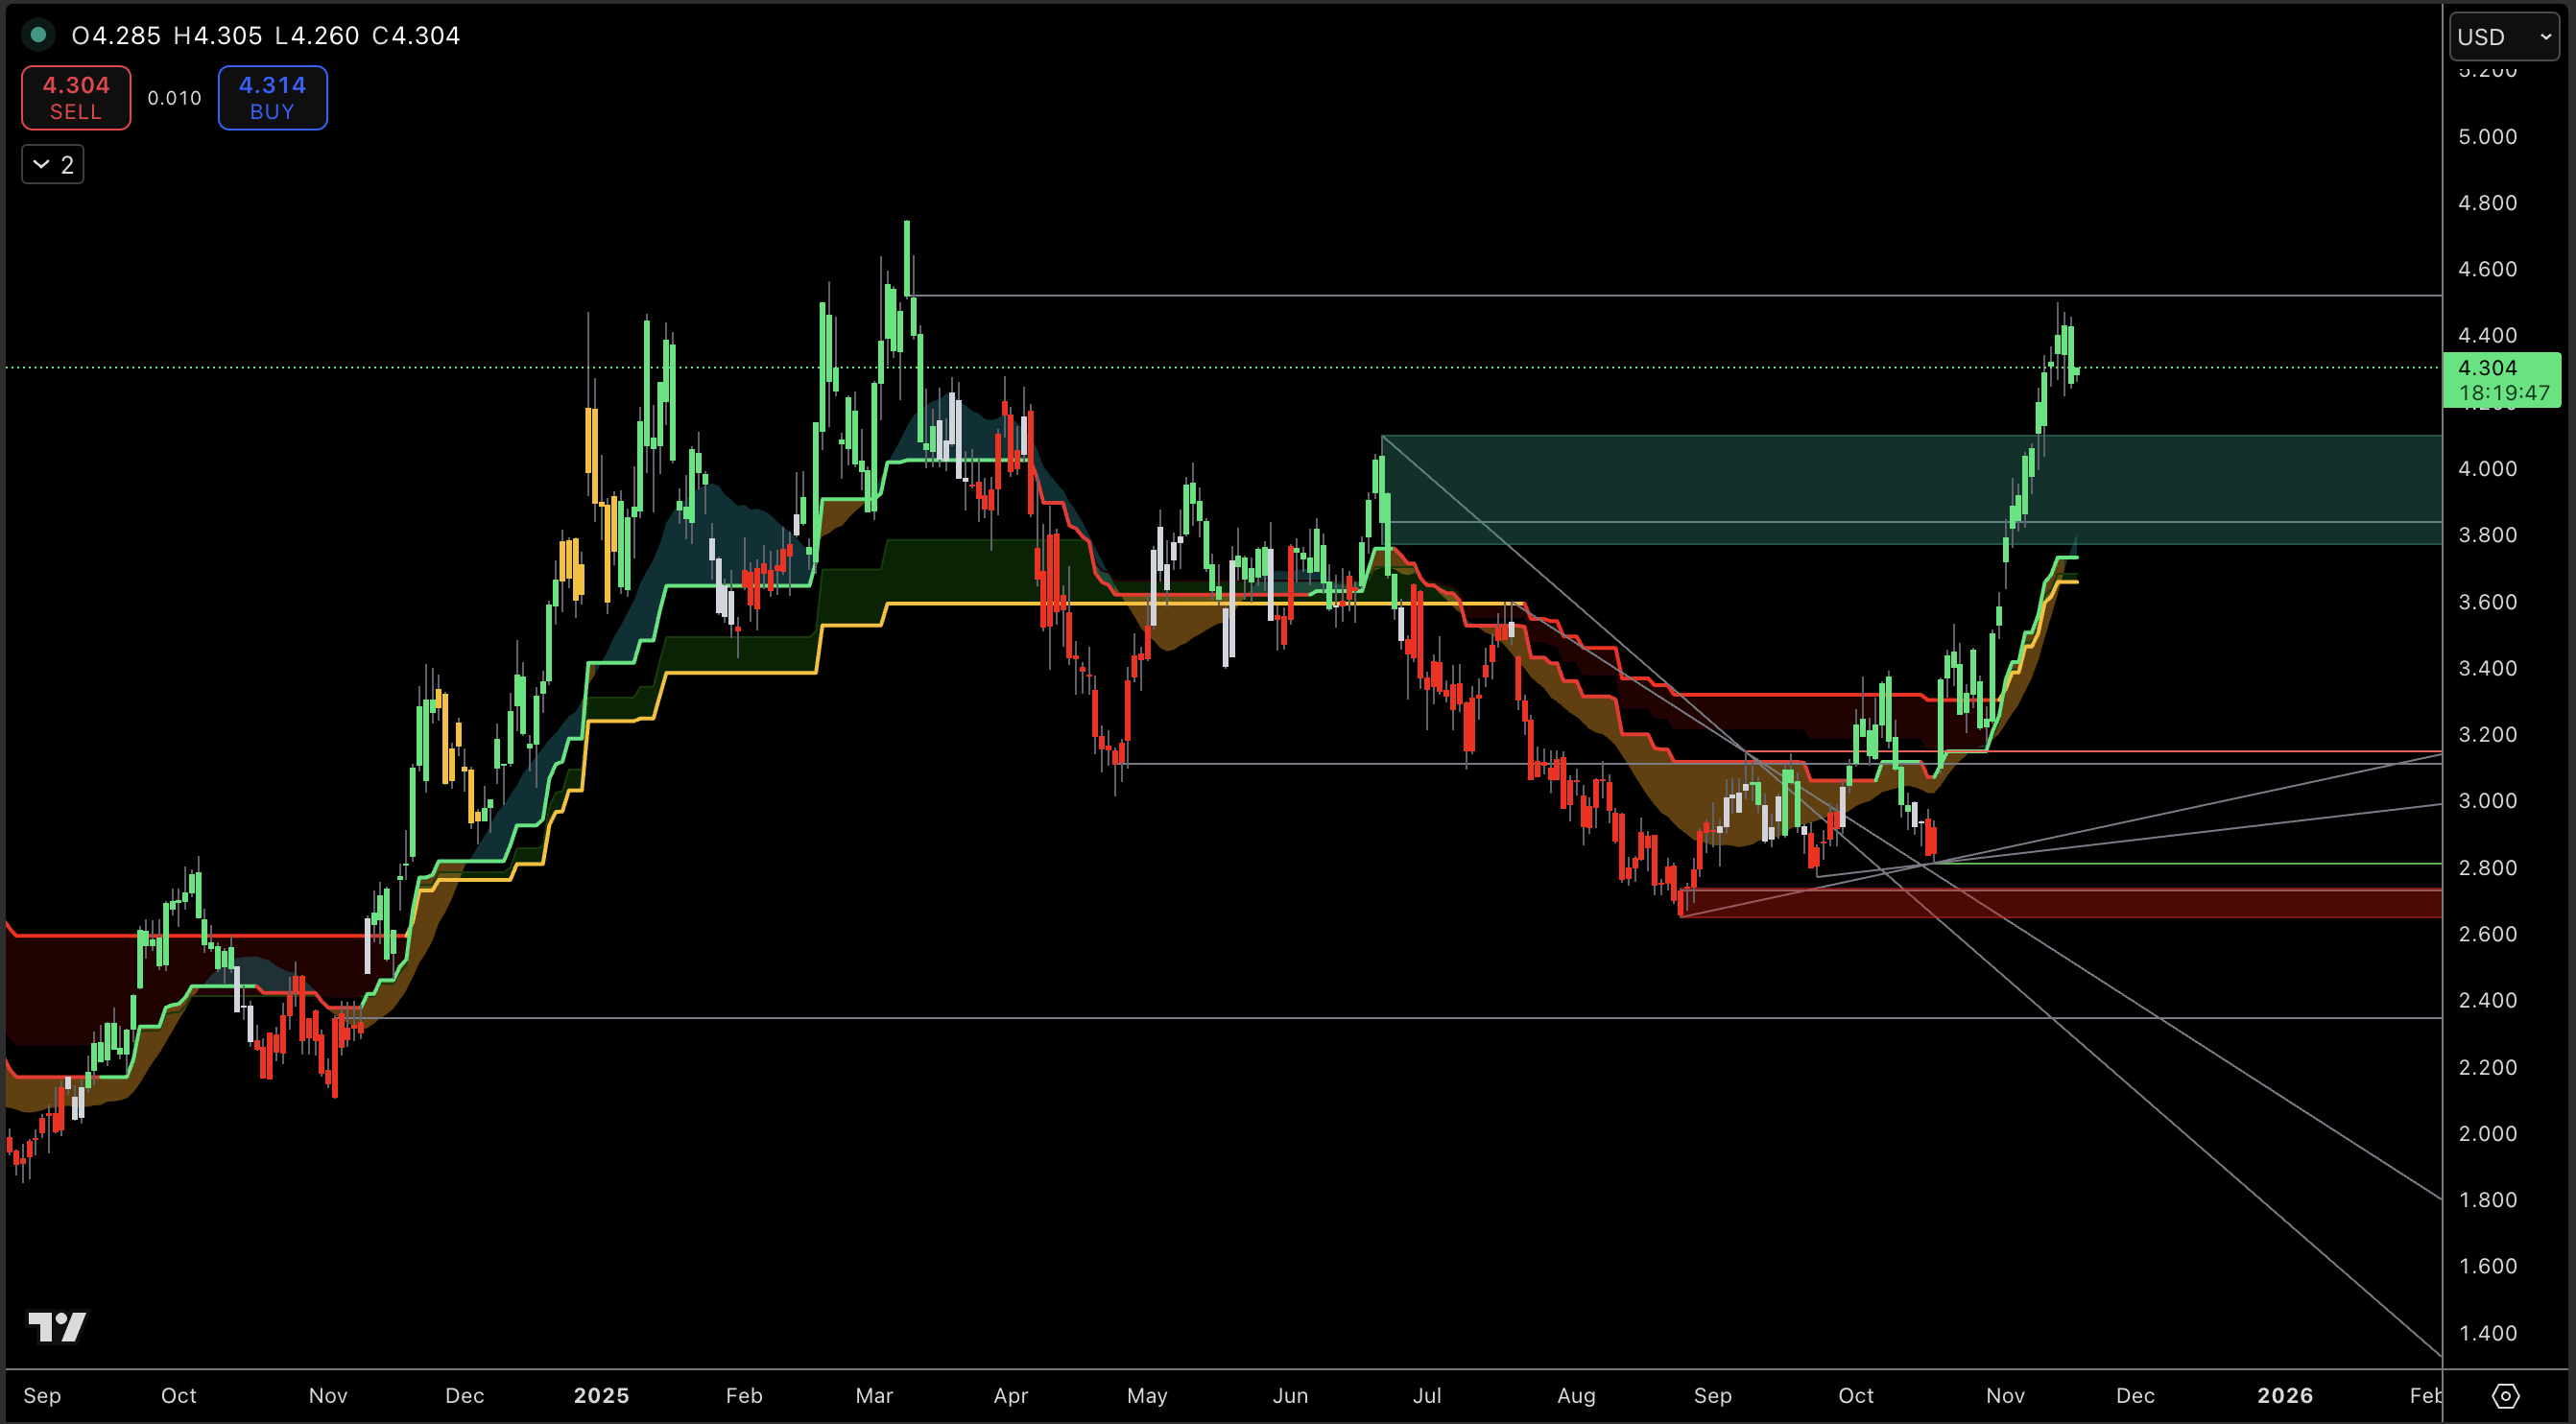
On a 4-hour chart, natural gas tends to trend, then mean-revert sharply around EIA storage releases and major weather model updates. Given current price location, intraday traders will likely focus on:
Short-term resistance near $4.60–$4.70, where repeated failures could invite quick fades.
Intraday support near $4.25–$4.30, corresponding to prior 4H highs and breakout retests.
Implied volatility in natural gas options remains elevated relative to many other commodities, reflecting recent price swings. For XNGUSD, this suggests using wider stops and smaller position sizes over the winter.
6-Month Paths for XNGUSD: Base, Bull and Bear
Base Case (Most Likely): Elevated, Volatile Range
In the base case, winter demand is moderate but not extreme, with La Niña bringing occasional cold snaps rather than a prolonged deep freeze, and storage is expected to finish winter slightly above or near normal levels.
In this scenario, XNGUSD could trade within a wide $3.80–$5.20 range over the next six months.
Price is likely to consolidate between $4.10 and $4.90, with repeated spikes above $5 on cold-weather forecasts or bullish EIA storage draws, followed by swift reversals when temperatures trend warmer or storage surprises on the high side.
For traders, this points to a range-trading approach with a bullish bias: accumulate on dips near support ($4.10, then $3.80) with defined stops, rather than chasing breakouts above $4.90 unless fundamentals signal a sustained tightening.
Bull Case: La Niña Cold Shot + Tight LNG Market
The bull case depends on sustained cold in key demand regions, frequent polar air outbreaks, and stable or rising LNG exports. Current La Niña projections and regional forecasts leave this scenario possible, though it is not the base expectation.
Some industry research suggests that under a cold La Niña winter, U.S. gas prices could, in an extreme, spike well above current levels, into double digits per MMBtu. That’s a tail risk, not a base target, but it shows how sensitive gas can be when storage is drawn down quickly.
In a strong bull scenario, a sustained break above $4.90–$5.20 could push XNGUSD toward $5.50–$7.00 by late winter, particularly if storage shifts from surplus to deficit relative to the five-year average by February-March.
Bulls should remain mindful that such rallies rarely occur in a straight line and are often followed by sharp mean reversion once weather-driven risk diminishes.
Bear Case: Warm Winter, Persistent Surplus
The bear case hinges on the warmer-than-average outlook for the southern and eastern U.S. verifying strongly, with only brief cold snaps and limited heating demand.
If storage remains 5-10% above the five-year norm through winter and injections resume early, the market will start to talk about another overhang into summer 2026.
Under that path, failed rallies above $4.70-$4.90 would drag XNGUSD back into the $3.50–$3.80 region, with a real risk of revisiting the $3.00-$3.20 base by April if production doesn’t respond and LNG utilisation dips.
This is a lower-probability path while price holds above $4.10-$4.20, but it’s the key risk for anyone leaning heavily long into a winter that might ultimately feel “average” to consumers.
How Traders Can Approach XNGUSD This Winter
Tactical Buy Zones and Invalidation Levels
Considering current conditions, the stance is cautiously bullish within a defined range. The uptrend is intact, macro fundamentals remain supportive, yet the market has already factored in a portion of winter-related risk.
A simple tactical framework many traders might consider (for educational purposes):
Look for pullbacks into $4.10-$4.20 as the first potential long area.
If price overshoots, the $3.80-$3.90 region lines up with deeper daily support.
Use $3.50-$3.60 as a bigger-picture line in the sand; weekly closes below there argue the winter bull thesis is failing.
Position sizing and stop levels should reflect the inherent volatility of natural gas. Winter swings of $0.30-$0.40 are normal market noise and do not necessarily undermine the trade’s underlying thesis.
Managing Longer-Term Exposure and Hedging
For swing traders and hedgers, the next six months are about respecting both the upside tail and the downside storage risk. Some ways market participants often manage this include:
Scaling in over several levels instead of all-in at a single price.
Considering partial profit-taking on spikes above $4.90–$5.20, where reward-to-risk shrinks.
For those with access to derivatives, using options structures (like call spreads) to define risk in a high-volatility winter tape.
None of this removes risk; it simply makes sure a single surprise such as an unexpected heatwave, a storage shock, or a geopolitical headline doesn’t wipe out a trading plan.
FAQs on XNGUSD and This Winter’s Outlook
1. Is XNGUSD likely to break above $5 this winter?
Yes, strong cold waves, higher LNG exports, or bullish storage draws could push it above $5. A sustained break of $4.90 with cold weather support is key.
2. How important is the NOAA winter outlook for gas prices?
The winter outlook sets the baseline for heating demand, but day-to-day weather drives prices. Even warmer forecasts can still see sharp cold snaps.
3. What role do LNG exports play for XNGUSD now?
High exports tighten domestic supply and support prices. Expected growth in 2025–26 makes them a key bullish factor.
4. Why can gas rally even when storage is above average?
Markets trade changes in supply tightness. Strong draws or high exports can lift prices even if storage is above average.
5. Is XNGUSD suitable for beginner traders?
Gas is very volatile. Use small sizes, tight risk limits, and focus on learning before trading large swings, trying to capture every intraday swing.
6. How often should traders watch the EIA storage report?
Weekly. Thursday releases can move prices sharply, with trades often placed before and after the report.
7. What could cause a sudden gas price crash despite winter?
Warm weeks, bearish storage, or LNG outages can trigger sudden gas price crash, especially if traders are heavily long.
Conclusion: Can Winter Demand Lift XNGUSD from Here?
XNGUSD heads into the 2025-26 winter in a very different position from the cheap gas of early 2024. Storage is comfortable but not bloated, LNG exports and structural demand are rising, and prices have already repriced higher into the mid-$4s.
Over the next six months, winter demand can keep XNGUSD elevated and deliver spikes above $5, but the market will likely trade a choppy, volatile range rather than a one-way move.
As long as price holds above $4.10-$4.20, and especially above $3.80-$3.50 dips look like opportunity, while failed pushes through $4.90-$5.20 will highlight how quickly gas mean-reverts once weather patterns shift.
Pro Tip: Stay nimble, respect the levels, and treat winter gas not as a lottery ticket, but as a high-volatility market that rewards discipline more than bravado.
Disclaimer: This material is for general information purposes only and is not intended as (and should not be considered to be) financial, investment or other advice on which reliance should be placed. No opinion given in the material constitutes a recommendation by EBC or the author that any particular investment, security, transaction or investment strategy is suitable for any specific person.
