Few commodities rival natural gas in sheer unpredictability. From frigid winters in the American Midwest to geopolitical tensions affecting transatlantic LNG flows, natural gas prices often swing violently in response to factors that defy simple forecasting. Traded under the ticker XNGUSD, this asset reflects the spot price of natural gas denominated in US dollars, and it has earned a reputation as one of the most dynamic instruments in energy trading.
Behind every price move lies a convergence of meteorology, macroeconomics, and market psychology. For traders and analysts alike, understanding what drives XNGUSD is not just an academic exercise—it's a critical edge in a market where fortunes can shift with the next weather model or inventory report.
What is XNGUSD?
XNGUSD represents the spot price of natural gas in US dollars. It is often traded through Contracts for Difference (CFDs) or futures contracts on commodities exchanges and brokerage platforms. The pricing benchmark typically aligns with the Henry Hub, a major natural gas pipeline hub in the United States. Traders use this price as a reference to speculate on the future direction of natural gas or to hedge exposure to the commodity.
Natural gas plays a vital role in global energy supply, used for electricity generation, industrial heating, and increasingly as a lower-emission substitute for coal. Its price is particularly sensitive to short-term demand shifts, making it one of the more volatile energy assets available to retail and institutional traders.
Key Market Drivers
 The price of XNGUSD is influenced by a complex array of market drivers. The most prominent among them include:
Weather Patterns: One of the most critical short-term drivers, especially during winter and summer months. Cold snaps lead to heating demand spikes, while heatwaves can increase electricity use for cooling.
Storage Levels: Weekly inventory reports from the U.S. Energy Information Administration (EIA) are closely followed. Higher-than-expected storage levels usually put downward pressure on prices, while lower inventories tend to support bullish sentiment.
Production Levels: Shale gas output in the U.S., particularly from the Appalachian Basin and Permian regions, directly affects supply dynamics.
Liquefied Natural Gas (LNG) Exports: The U.S. has become a top LNG exporter, with global demand from Europe and Asia playing a large role in shaping domestic prices.
Pipeline Flows and Maintenance: Interruptions or changes in pipeline supply (e.g., from Canada or internal distribution in the U.S.) can also impact spot pricing.
Price Volatility & Liquidity
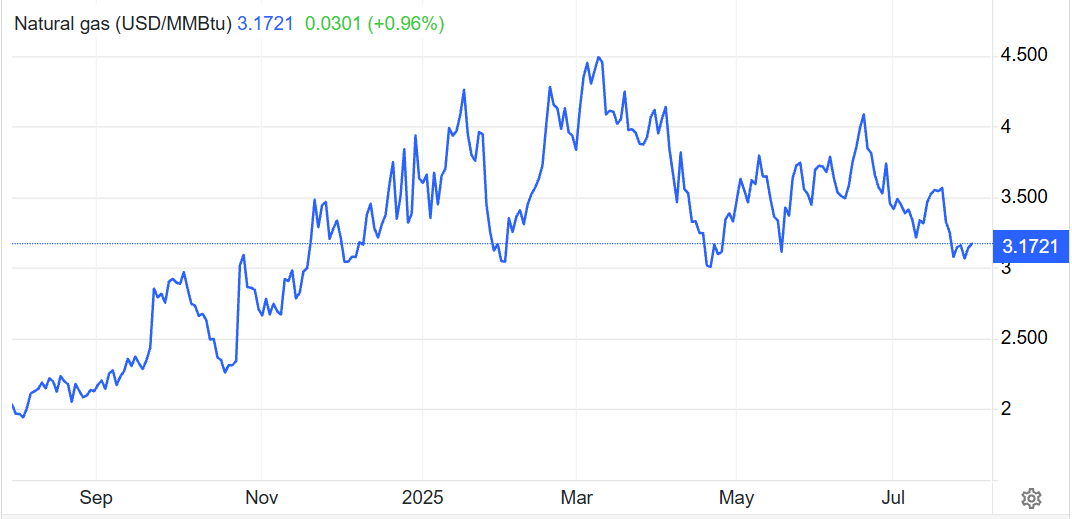
XNGUSD is notoriously volatile. Unlike oil, which tends to trend over longer time frames, natural gas often whipsaws sharply in reaction to weather forecasts, storage updates, or shifts in sentiment. A sudden change in weather modelling—say, a warmer forecast for February—can send prices tumbling in a matter of hours.
Liquidity is relatively high during U.S. trading hours, particularly around the EIA weekly inventory report released every Thursday. However, slippage and widened spreads may occur during off-hours or in times of low market participation (e.g., holidays or overnight sessions).
For these reasons, many traders approach XNGUSD with tight risk controls and short trading time horizons, using stop-loss and take-profit levels to manage exposure effectively.
Fundamental Influences
Several underlying factors shape the longer-term trend in XNGUSD:
Seasonal Demand: Winters and summers both see higher demand, leading to price spikes during extreme conditions. The "shoulder seasons" (spring and autumn) typically see more subdued activity.
Geopolitical Events: While natural gas is a domestically abundant resource in the U.S., global geopolitics can play a role—especially in LNG trade. European reliance on U.S. LNG increased after the Russia-Ukraine conflict disrupted gas supplies across the continent.
Economic Activity: Industrial demand tends to track economic cycles. A strong economy usually increases demand for electricity and manufacturing, both of which rely heavily on natural gas.
Regulatory Policies: Emissions caps, clean energy subsidies, and pipeline permitting all affect future supply growth, especially in environmentally sensitive regions.
These fundamentals not only affect spot pricing but also shape the forward curve in futures markets—something traders watch closely to understand market expectations.
Technical Chart Patterns
Due to its volatility and responsiveness to short-term events, XNGUSD is a favourite among technical traders. Several commonly used patterns and indicators include:
Support and Resistance Zones: Traders often look at recent lows (e.g., $2.96 as a technical floor) and previous highs to guide entries and exits.
Trend Channels: Natural gas often trades in upward or downward channels, and breakouts from these ranges can signal strong directional moves.
Candlestick Patterns: Reversal formations like hammer, engulfing patterns, or doji are used on intraday and daily charts.
Indicators: Popular tools include Relative Strength Index (RSI), MACD, and moving averages, especially the 20‑, 50‑, and 200‑day lines.
Volume Analysis: Spikes in volume during key price moves often validate trend strength.
These technical tools complement fundamental insights, allowing traders to fine-tune their timing in a highly reactive market.
Trading Considerations & Risks
Trading XNGUSD involves certain operational and strategic considerations. First, traders must choose the right instrument—whether via CFDs, futures, or ETFs tracking gas prices. CFD brokers typically offer access to XNGUSD with leverage, but spreads and overnight swap fees should be carefully evaluated.
Some of the major risks include:
Volatility Risk: Prices can move several percentage points within hours. Overleveraged positions may trigger margin calls quickly.
Gapping: During illiquid periods or weekend gaps, prices may open significantly higher or lower than expected, leading to slippage.
Spread Costs: Especially outside of peak trading hours, the bid-ask spread can widen considerably, eating into profit potential.
Regulatory Exposure: U.S.-based natural gas markets are subject to policy changes that can alter production outlooks.
To mitigate these risks, disciplined traders employ position sizing strategies, use hard stop-losses, and monitor economic calendars for key releases such as the EIA report and NOAA weather forecasts.
Final Thoughts
XNGUSD offers a unique blend of macro sensitivity, technical tradeability, and seasonal complexity. While it requires caution due to its volatility, it also presents lucrative opportunities for traders who understand its behaviour and use appropriate risk management tools.
Whether one is hedging exposure, speculating on energy cycles, or engaging in short-term momentum plays, natural gas trading through XNGUSD is both challenging and rewarding. As global energy markets evolve—particularly with the growth of LNG and the shift toward cleaner fuel sources—XNGUSD will remain at the centre of the conversation, reflecting the pulse of one of the world's most essential and unpredictable commodities.
Disclaimer: This material is for general information purposes only and is not intended as (and should not be considered to be) financial, investment or other advice on which reliance should be placed. No opinion given in the material constitutes a recommendation by EBC or the author that any particular investment, security, transaction or investment strategy is suitable for any specific person.
