Published on: 2026-01-02
Updated on: 2026-01-02
Oil is among the most actively traded commodities globally, with price moves that routinely spill into inflation data, geopolitics, and broader financial markets such as currencies, equities, and rates.
Oil prices can change fast, often without warning. Market narratives shift quickly, and leverage leaves little room for error. Knowing how to trade oil means going beyond a directional view and understanding how the market is structured, which instruments to use, what truly drives price, and how risk must be controlled.
This guide breaks down how professional traders actually trade oil, and how those same frameworks can be used at the retail level.
Before placing a trade, you must understand what you are trading. Oil is not a single asset but a global system of benchmarks, contracts, and physical constraints.
When trading oil online, you are not purchasing or taking delivery of physical crude. Instead, exposure is gained through financial instruments such as contracts for difference (CFDs), oil futures, options, and exchange-traded funds (ETFs), each offering different advantages, costs, and risk profiles depending on the trader’s objectives and time horizon.

Oil prices quoted in the media usually refer to benchmark crude grades, not physical barrels.
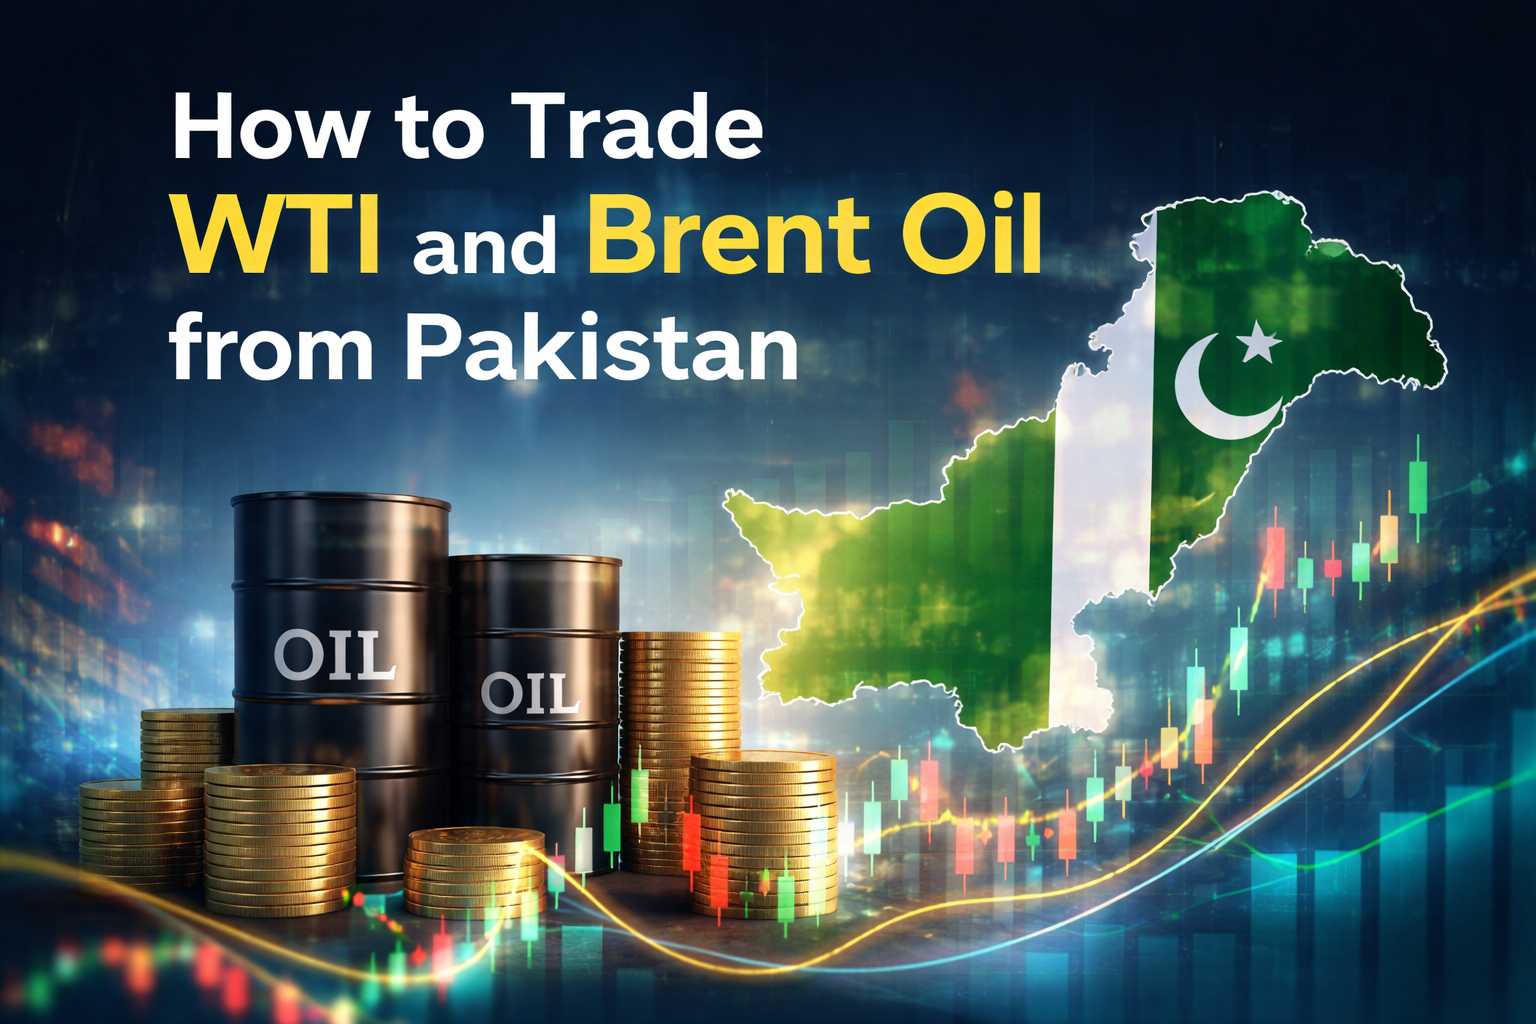
West Texas Intermediate (WTI) - The primary U.S. benchmark, traded on NYMEX
Approx. $57.5-$59 per barrel (January 2026)
Brent Crude - The dominant global benchmark, reflecting North Sea supply
Approx. $60-$62 per barrel (January 2026)
WTI tends to be more sensitive to U.S. inventory data, pipeline capacity, and domestic production trends. Brent, by contrast, better reflects global supply-demand dynamics and geopolitical risk.
Oil is a forward-looking market. Prices typically reference the front-month futures contract, not spot delivery. Futures prices incorporate expectations about:
Storage availability
Interest rates
Future supply conditions
Anticipated demand shifts
This is why oil can rally during weak current demand, or fall despite tight spot markets.
Oil trading is not rigid. While dozens of physical crude grades exist, most traders access oil through liquid, standardized instruments tied to global benchmarks.
Professional and retail traders using regulated brokers such as EBC Financial Group typically trade oil via CFDs linked to futures pricing, avoiding physical delivery, storage, or roll complexity.
| Category | Instrument | Ticker (Common) | What It Represents | Why Traders Use It |
|---|---|---|---|---|
| Global Crude Benchmarks | WTI Crude | CL (NYMEX) | Primary U.S. light sweet crude oil | High liquidity and strong sensitivity to U.S. inventory and production data |
| Global Crude Benchmarks | Brent Crude | BRN / BZ (ICE) | International oil pricing benchmark | Best proxy for global supply-demand dynamics and geopolitical risk |
| Index-Linked Exposure | Oil CFDs | WTI / Brent CFD (broker-specific) | Futures-linked oil price exposure | No physical delivery, transparent pricing, and efficient execution |
WTI is a light, sweet crude that serves as the cornerstone of U.S. oil pricing. It is particularly sensitive to:
Weekly U.S. inventory data
Shale production trends
Pipeline and storage constraints
WTI often reacts sharply to reports from the U.S. Energy Information Administration, making it a preferred instrument for short-term and event-driven strategies.
Brent is the dominant benchmark for oil traded outside North America. It reflects global fundamentals more accurately and is heavily influenced by:
Geopolitical risk
OPEC+ policy decisions
Global shipping and trade flows
Brent is often favored for macro-driven and medium-term oil trades.
CFD-based oil trading offers efficient access to oil price movements:
No physical settlement
No storage considerations
Futures-based price discovery
Transparent contract specifications
For traders focused on price action rather than logistics, this structure is optimal.
Professional oil traders organize market drivers into clear categories to separate structural signals from short-term noise. Some of the key drivers that affect oil prices include:
Production policy from OPEC+ often anchors medium-term price trends.
U.S. shale output responds rapidly to price changes, frequently capping rallies or accelerating declines.
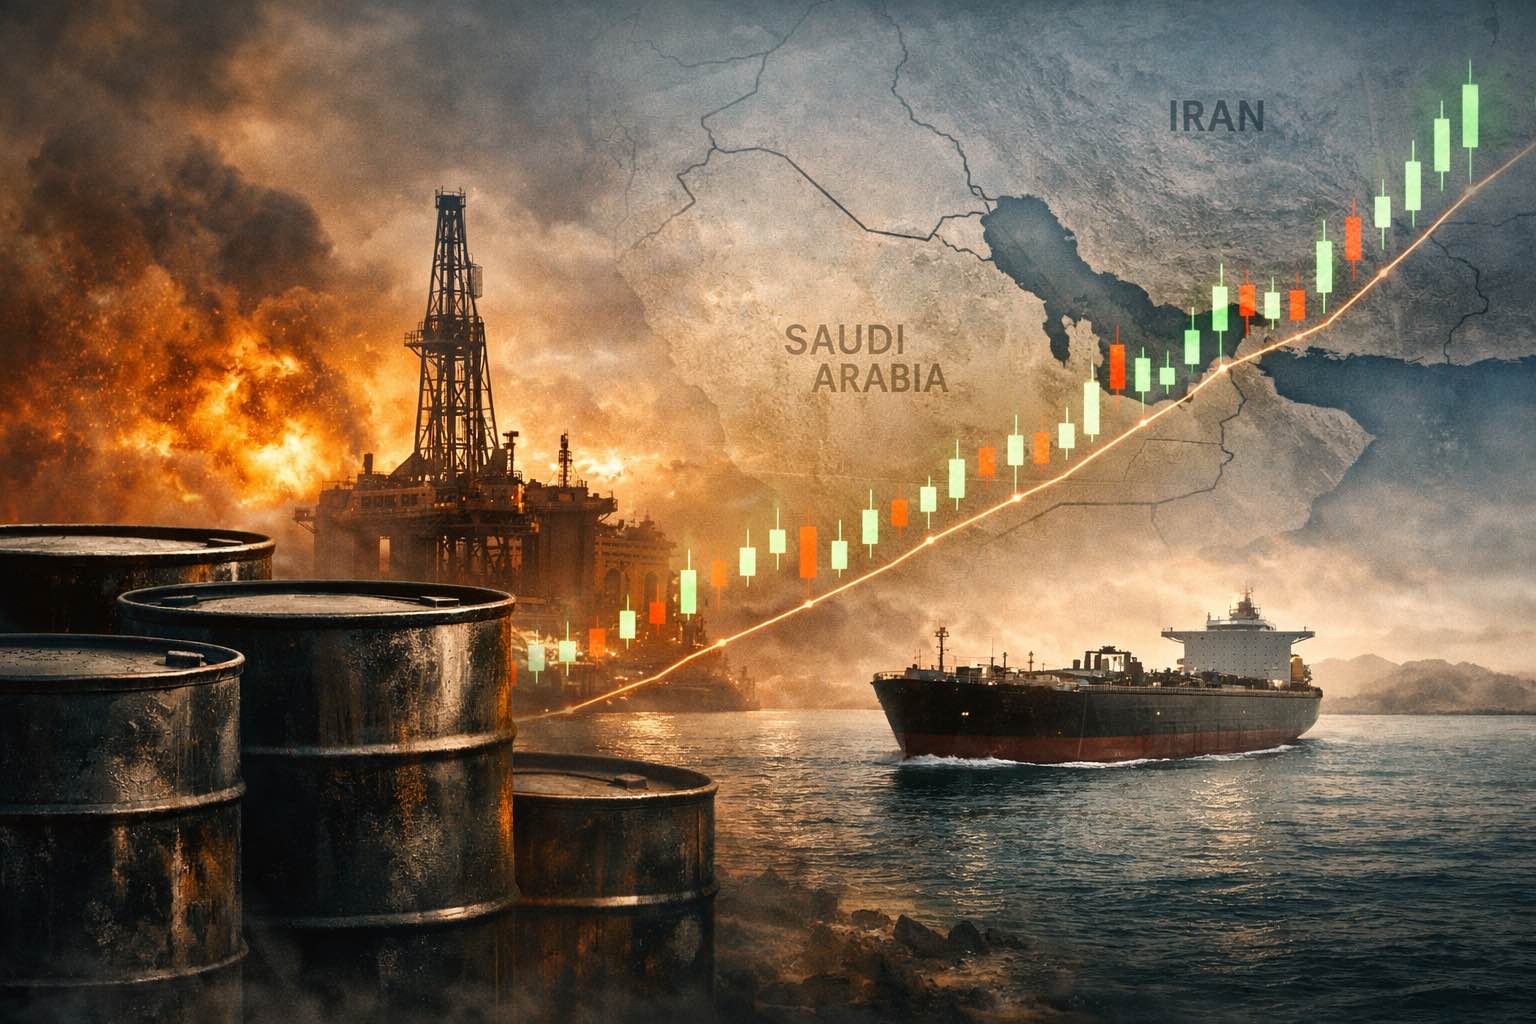
Geopolitical disruptions, especially in the Middle East or involving Russia, add risk premiums when exports or shipping routes are threatened.
Global GDP growth defines baseline oil consumption.
Chinese industrial activity has an outsized influence through imports, manufacturing output, and strategic stockpiling.
Seasonal demand matters: summer boosts gasoline consumption; winter raises distillate demand.
Weekly U.S. crude and product inventories provide real-time feedback on market balance.
Prices react to surprises versus expectations, not headline numbers.
Persistent draws signal tightening supply; sustained builds imply oversupply.
A stronger U.S. dollar typically pressures oil prices.
Rising inflation expectations attract hedge and speculative flows into oil.
Risk sentiment drives positioning, with oil benefiting in risk-on environments and suffering during financial stress.
Correct position sizing is the foundation of survival in oil trading.
The principle is simple: Decide your risk first, then size the trade so your stop loss defines that risk.
Lot Size = Risk Amount ÷ (Stop Loss × Value per Point)
Where:
Risk Amount = 1–2% of account equity
Stop Loss = distance from entry (in dollars)
Value per Point = dollar value of a $1 move per lot
Assume:
Account size: $10,000
Risk per trade: 1% → $100
Stop loss: $1.00
Value per $1 move (1 lot): $100
Lot Size = $100 ÷ ($1.00 × $100) = 1.0 lot
Outcome:
Stop hit → loss capped at $100
$1 favorable move → $100 profit
This discipline is non-negotiable for serious traders.
Another way to trade oil properly is to analyze its long-term trends. Long-term crude oil charts reveal how macro forces, supply constraints, and policy decisions translate into sustained price trends. Weekly and monthly charts are particularly valuable because they strip out short-term noise and highlight structural behavior that governs oil markets over extended periods.
On a weekly WTI chart, traders typically annotate:
Higher highs and higher lows during tightening supply phases, often driven by U.S. inventory drawdowns or rising shale breakevens.
Lower highs following periods of aggressive production growth or demand slowdowns signal oversupply.
Long consolidation ranges that precede major breakouts, especially after OPEC policy shifts.
Brent charts often display cleaner, smoother trends over the same periods, reflecting their stronger linkage to global supply-demand balance rather than U.S.-specific infrastructure constraints.

People trade oil because it is one of the most liquid and actively traded markets in the world, offering frequent price movements and tight pricing.
Driven by real-world factors such as supply disruptions, production decisions, inventory data, and economic growth, oil provides clear fundamental catalysts that create regular trading opportunities across short-term and medium-term time horizons.
Oil is also closely tied to macroeconomic trends and geopolitics, making it a powerful instrument for expressing views on inflation, global growth, or political risk.
With multiple ways to gain exposure, such as CFDs, futures, options, and ETFs, traders can participate without handling physical crude, while using oil to diversify portfolios or hedge against broader market risks.
Select a regulated and reputable broker such as EBC Financial Group, which offers access to oil CFDs, reliable execution, and professional trading platforms.
Register for a trading account and complete the required verification process so you can access the markets securely.
Understand how oil CFDs track prices, how leverage and margin work, and the risks involved. Using a demo account is a good way to practice without risking real money.
Decide how you will trade oil, how much risk you will take per trade, and where you will place stop-loss and take-profit levels.
Deposit only capital you can afford to trade, based on your risk tolerance and experience level.
Place trades using the platform and always manage risk by using stop-loss orders. Monitor your positions and adjust your strategy as market conditions change.
Trading headlines without assessing real supply-demand impact
Ignoring futures roll and contango effects on longer holds
Using excessive leverage during high-volatility periods
Treating WTI and Brent as interchangeable instruments
Holding full positions through known event risks (OPEC meetings, inventory releases)
Overtrading during low-conviction, range-bound markets
Yes, oil is one of the most actively traded commodities in the world, offering deep liquidity, tight spreads, and frequent intraday price movements. Regular catalysts such as inventory reports, geopolitical headlines, and macro data create consistent opportunities, but the same volatility means risk must be tightly controlled with predefined stops and disciplined position sizing.
WTI is generally better suited for short-term and U.S.-focused trading strategies because it reacts strongly to U.S. inventory data, shale production trends, and domestic infrastructure developments. Brent, by contrast, is more influenced by global supply-demand dynamics and geopolitics, making it preferable for traders expressing broader macro or medium-term views.
Professional traders use leverage conservatively, often far below the maximum allowed by brokers. Because oil can move sharply in short periods, excessive leverage increases the risk of forced exits or account drawdowns, whereas lower leverage allows traders to survive volatility and compound returns over time.
No. While oil can contribute to inflation and sometimes acts as an inflation hedge, its price is primarily driven by the physical supply-demand balance. Periods of weak demand, rising inventories, or increased production can push oil lower even when inflation is elevated, underscoring the need to analyze fundamentals rather than rely on simple correlations.
Learning how to trade oil starts with understanding how the market works, such as what drives prices, which instruments to use, and how benchmarks like WTI and Brent behave differently. Successful oil trading requires a clear framework that combines market structure, fundamental drivers, chart analysis, and disciplined execution.
By using proper position sizing, managing leverage carefully, and aligning trades with both macro conditions and price trends, traders can approach oil markets with consistency rather than speculation. Oil offers a significant opportunity, but only to those who treat it as a structured market rather than a directional gamble.
Disclaimer: This material is for general information purposes only and is not intended as (and should not be considered to be) financial, investment, or other advice on which reliance should be placed. No opinion given in the material constitutes a recommendation by EBC or the author that any particular investment, security, transaction, or investment strategy is suitable for any specific person.