Bitcoin’s latest slide has rattled traders again. After setting fresh all-time highs above 126,000 USD in October, BTC fell to lows near 82,000 USD in late November and is now trading back around 86,000 USD as selling pressure returns. That still leaves Bitcoin down by roughly one-third from its peak and keeps the wider crypto market under pressure.
This move isn’t driven by a single story. Several things are hitting the market at the same time: macro pressure, ETF outflows, on-chain selling and broken support levels.
This article explains why Bitcoin is dropping right now, how the trend looks across different timeframes, and which levels many traders are watching.
Why Is Bitcoin Falling Right Now?
In simple terms, Bitcoin is falling because the market has flipped from greed to fear while liquidity is still leaving the asset. From the October peak above 126,000 USD to the late-November low near 82,000 USD, the drawdown reached about 35%. Even after bouncing and now trading back around 86,000 USD, BTC is still roughly 32% below its high, and today’s move is another leg inside that same correction.

Today’s drop is driven mainly by:
Macro uncertainty and Fed fears: Markets are no longer convinced about fast U.S. rate cuts. Tighter financial conditions and tariff-driven inflation worries have hit risk assets, including crypto.
Heavy ETF outflows: Spot Bitcoin ETFs have seen almost 3 billion USD of net outflows in November, including record single-day withdrawals from BlackRock’s IBIT fund.
Whale and long-term holder profit-taking: On-chain data shows billions of dollars in BTC moving from whale and long-term wallets to exchanges, locking in gains from this year’s rally.
Rising exchange reserves and liquidations: BTC balances on Binance and other exchanges have climbed, and futures liquidations have accelerated as key support levels broke.
Technical breakdown: Price has sliced through the 100,000 USD psychological level and dropped below cluster resistance from short-term moving averages, with most technical ratings now flashing “strong sell.”
Recent Performance of Bitcoin: 1 Week, 1 Month, 6 Months
Before looking at the drivers of btc drop, these performance periods will help to see the recent path.
Bitcoin - Last Week
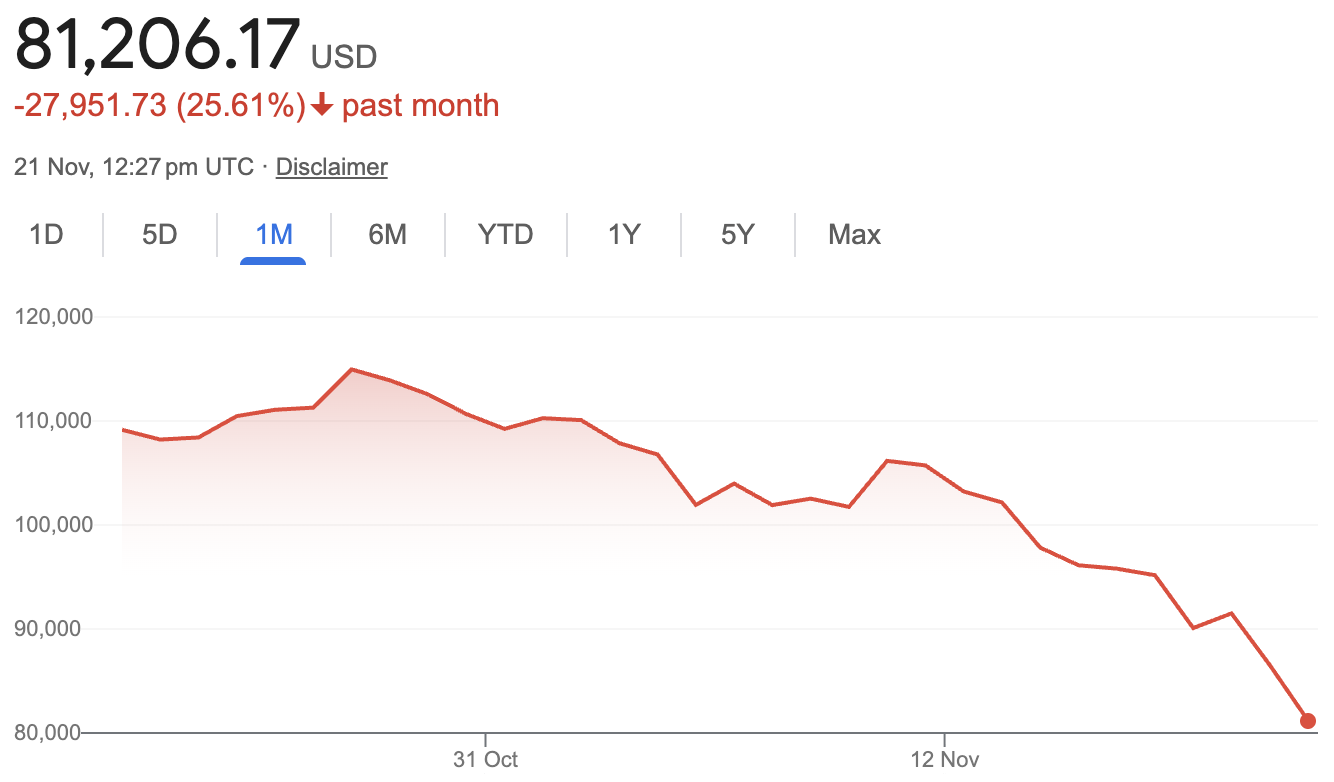
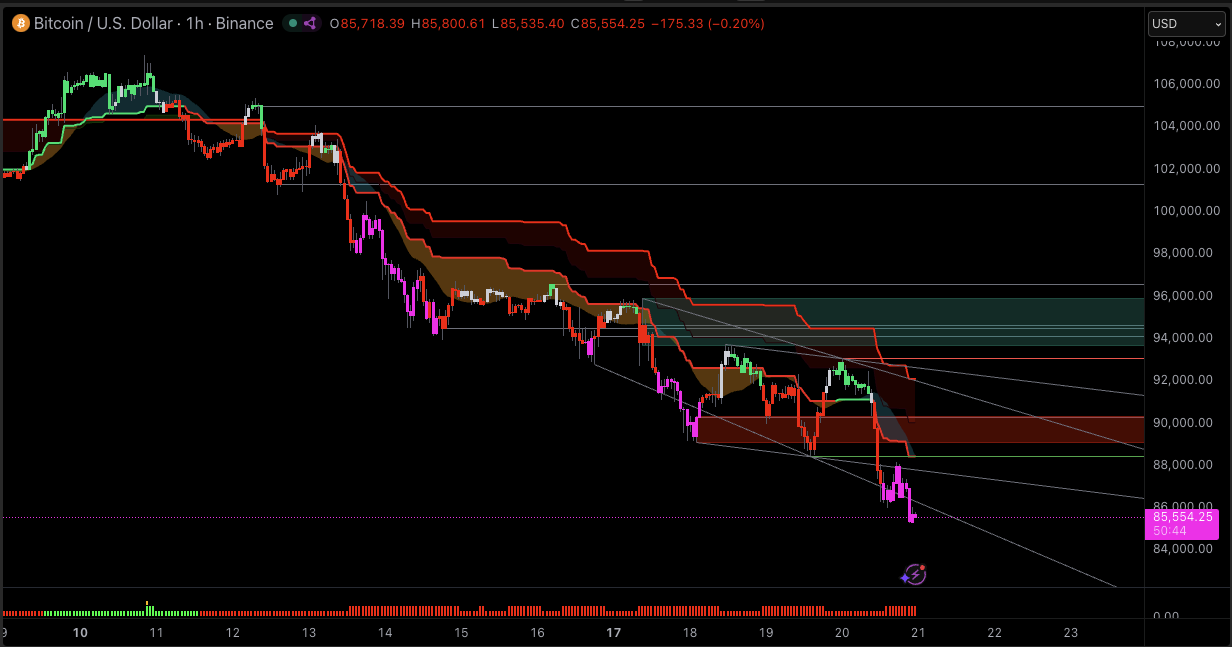
During the week from 14 to 21 November 2025, Bitcoin dropped from around 100,000 USD into the low-80,000s. Charts data shows a move from roughly 99,700 USD on 14 November to about 82,000 USD on 21 November, a drop of about 18%.

The fall has not been a straight line, but each bounce has been weaker. Support near 95,000 USD failed first, followed by a clean break below 90,000 USD that triggered more selling and a wave of forced liquidations.
Bitcoin - Last 1 Month
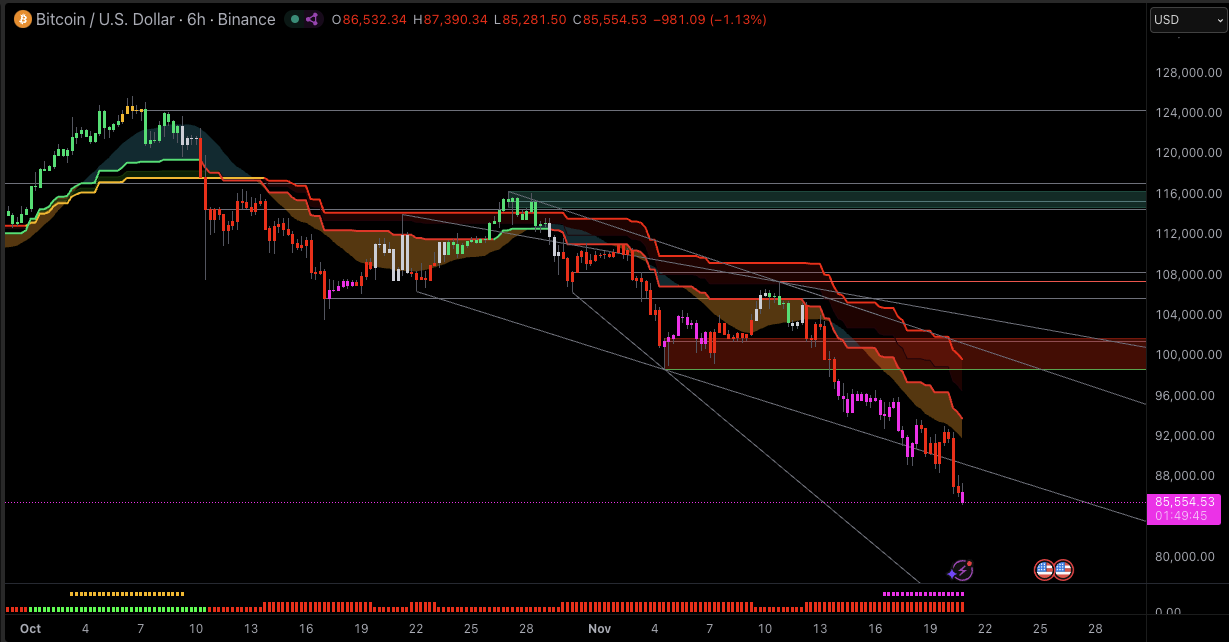
At the start of October, Bitcoin was trading near 125,000 USD at its peak. From that high to the late-November low around 82,000 USD, it fell by roughly 34–35%. Even after recovering and now trading back near 86,000 USD, the drop from the peak is still close to 31%.

The pattern is classic distribution then breakdown:
Once 95,000 and 92,000 USD gave way, momentum picked up, with ETFs and futures traders pushing the move lower.
Bitcoin - Last 6 Months
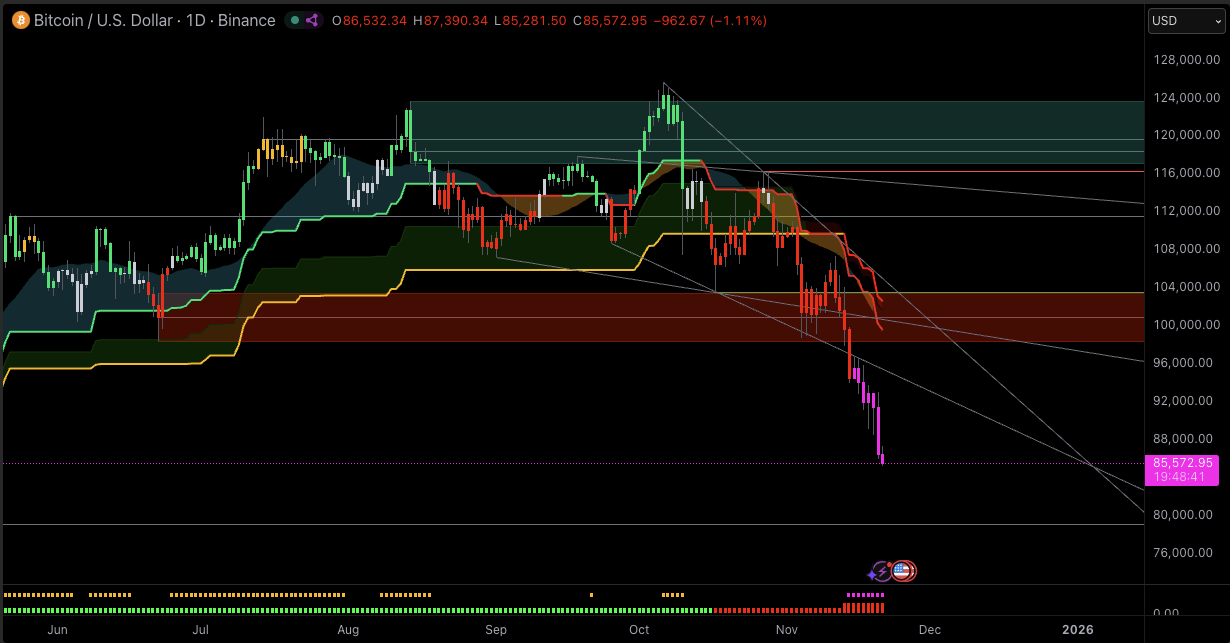
Zooming out, BTC is still above the lows seen in April around 74,400 USD but well below the cluster of all-time highs around 109,000-126,000 USD reached in May and October.

In other words, the current move looks like a deep correction inside a longer bull cycle that began after the 2022-2023 bear market. That context matters: traders are dealing with a sharp drawdown inside what still resembles a higher-timeframe uptrend.
Main Reasons Behind Bitcoin’s Drop
1. Macro Pressure and Fed Uncertainty
The first driver is the macro backdrop. U.S. data has been mixed, and the December Federal Reserve meeting now looks less likely to deliver the aggressive rate cuts some traders were counting on.
Higher-for-longer rates hurt assets that rely on future growth and liquidity, including crypto. At the same time, renewed tariff headlines and trade-war worries have lifted inflation fears, feeding a risk-off mood across equities, tech and digital assets.
We have also seen a broad global sell-off: major stock indices pulled back, volatility rose, and Bitcoin dropped alongside them instead of acting as a hedge.
2. Spot ETF Outflows and Institutional De-Risking
The second big driver is ETF flows. After months of strong inflows, November has flipped into heavy redemptions.
U.S. spot Bitcoin ETFs have seen roughly 3.5–3.7 billion USD of net outflows over November, according to Bloomberg and other ETF trackers, making it their worst month since launch.
BlackRock’s flagship IBIT product recorded record daily withdrawals above 500 million USD as Bitcoin broke below 90,000 USD, while several other funds also saw heavy redemptions.
Combined selling from multiple ETFs forced the market to absorb large blocks of BTC in a short window. In the final week of November, flows briefly turned modestly positive again, but that late improvement has not yet offset the earlier outflows or fully eased the pressure on price.
These flows matter because many institutional holders access Bitcoin almost entirely through ETFs. When those products see redemptions, funds must sell the underlying BTC. That turns sentiment shifts into direct market selling.
3. On-Chain Signals: Exchange Reserves and Whale Activity
On-chain data confirms the selling pressure.
CryptoQuant data shows strong positive netflows to major exchanges, especially Binance, as more coins move from private wallets onto trading venues.
Bitget and other analyses highlight:
Binance’s BTC reserves climbed above 580,000 coins.
Average deposit volume rising, a pattern often seen when investors prepare to sell.
Over 400,000 BTC changing hands from long-term holder wallets in recent weeks, as some early-cycle investors lock in multi-year profits.
At the same time, there is a split inside the whale community. Some long-term whales and ETF custodians are reducing risk, while “permanent holder” wallets that have never spent coins are quietly accumulating during the drop.
This helps explain the choppy price action: strong sell waves from certain groups are being partly absorbed by others taking the other side.
4. Technical Breakdown and Liquidations
Finally, the chart has turned against the bulls.
Price first lost the 100,000 USD level, which had lined up with key weekly moving averages and the one-year VWAP. Then it slid below 95,000 and 92,000 USD, triggering large futures liquidations and a “risk-off” cascade.
Several technical services now flag Bitcoin as a strong short-term sell: TradingView shows moving-average-based ratings in “strong sell” territory, while oscillators are mixed but no longer clearly bullish.
Breaks of big round numbers often add a psychological layer. The move through 100,000 USD and then 90,000 USD shook confidence, pushed Fear & Greed indices into “extreme fear,” and encouraged traders to cut risk rather than “buy the dip.”
Technical View: Key Levels Traders Are Watching on Bitcoin
From a technical perspective, Bitcoin is currently in a short-term downtrend on both the daily and 4-hour charts. Highs have been getting lower since October, and the latest leg has pushed momentum into oversold territory on several indicators.
Current Trend, Momentum, and Indicators
Here is a simplified snapshot of key technical indicators as of late November 2025:
| Indicator |
Timeframe |
Latest reading / status |
Signal |
What it suggests |
| RSI (14) |
Daily |
Around 15 (deep oversold) |
Oversold |
Selling has pushed price to very stretched levels; short-term relief bounces are common from this zone, even inside a downtrend. |
| MACD (12,26) |
Daily |
Around -982 |
Bearish |
Momentum remains negative; there is no clear daily trend reversal yet. |
| Moving averages (MA5–MA200) |
Daily |
Price below all key MAs |
Strong sell |
All major daily moving averages sit above price, keeping the short-term structure bearish. |
| Pivot (Fibonacci) |
Daily |
Pivot near 86,980 USD |
Neutral / reference |
This area acts as a nearby reference level; sustained trading below it keeps pressure on the downside. |
| Technical rating |
Daily |
Summary: “Strong Sell” |
Trend down |
Technical dashboards still classify BTC as being in a short-term downtrend across daily timeframes. |
This mix tells a clear story: the trend is down, but the market is getting stretched. The daily RSI below 30 has historically marked areas where at least short-term bounces often appear, though not always immediately.
Important Support and Resistance Zones
Instead of bullets, here is how many traders are mapping key levels:
| Level (USD) |
Role |
Context |
| 100,000 |
Major broken support |
Big psychological figure; aligned with key weekly averages and RVWAP that have now failed. |
| 94,000–95,000 |
Former short-term floor |
Area of recent consolidation and breakdown, now early resistance if price bounces. |
| 90,000 |
Lost support |
First break below in seven months; the region that triggered the “crash” headlines. |
| 85,000 |
Next key support zone |
Highlighted by several technical and on-chain studies as the next big level below. |
| 75,000–76,000 |
Deeper support |
April low region and a level some macro-focused analysts are watching if stress worsens. |
| 94,000–97,000 |
Near-term upside target |
— |
Reclaiming this band, which includes key EMAs, would be an early sign that bears are losing control.
What Bulls and Bears Are Looking For
For bulls, positive signs would include:
Daily RSI lifting back above 30 while price holds above 85,000 USD.
A daily close back above the 90,000-94,000 zone and then through the 4-hour EMA cluster near 93,000-100,000 USD.
ETF outflows slowing, or even turning positive, which would signal fresh institutional demand returning.
For bears, key signals include:
A clean daily close below 85,000 USD with no fast rebound, opening the door to tests of 75,000-76,000 USD.
Continued ETF redemptions and rising exchange reserves, showing that large holders are still selling into any strength.
Failed rallies that stall under the EMA cluster, confirming that the path of least resistance remains lower.
Frequently Asked Questions (FAQ)
1. Why is Bitcoin falling today?
Today’s weakness comes from a mix of macro fear, heavy ETF outflows, and a break below key price levels like 100,000 and 90,000 USD. Together these factors pushed BTC down to seven-month lows around 82,000 USD in late November. After a short bounce above 90,000 USD, price is now back under pressure and trading in the mid-80,000s.
2. Did ETF outflows cause the latest Bitcoin drop?
ETF outflows are not the only cause, but they are a major driver. Spot Bitcoin ETFs have shed around 3.5–3.7 billion USD in November, including record daily redemptions from funds such as IBIT. That forced selling added strong downward pressure on the spot price, even though flows turned modestly positive again toward the end of the month.
3. Will Bitcoin recover after this drop?
No one can guarantee a recovery, but history shows BTC has often bounced after deep corrections, especially when daily RSI is oversold and halving-driven supply remains tight. Right now, daily RSI is back in deep oversold territory and ETF flows have started to stabilise, but a sustained recovery would still need calmer macro conditions and a clear return to net ETF inflows rather than just a few positive days.
4. Is Bitcoin too risky to trade right now?
Bitcoin is always high risk, and current conditions are especially volatile. Large intraday swings, high leverage in derivatives, and macro uncertainty mean position sizing and strict risk management are essential. Many traders scale down size or wait for clearer levels before re-entering.
Final Thoughts: What This Drop in Bitcoin Really Means
Bitcoin’s latest fall is the result of several forces lining up at once: a tougher macro backdrop, aggressive ETF outflows, on-chain selling from whales and long-term holders, and a clear technical breakdown below big psychological levels.
Price never moves on one story alone. Fundamentals, sentiment and technical levels all interact, and right now they are pointing in the same direction: caution. For some, that is a warning to reduce risk.
For others, oversold readings and long-term supply scarcity look like the early stages of a new opportunity.
Disclaimer: This material is for general information purposes only and is not intended as (and should not be considered to be) financial, investment or other advice on which reliance should be placed. No opinion given in the material constitutes a recommendation by EBC or the author that any particular investment, security, transaction or investment strategy is suitable for any specific person.


