Published on: 2026-08-10
The U.S. economy shed 23,000 jobs in July when economists polled by Reuters expected a gain of around 80,000, and the S&P 500 responded by climbing 0.62% to a record close of 7,757.64. The Nasdaq Composite rose 1.30% to 26,690.62, the Russell 2000 gained 1.10% and the Dow added 0.28% to 54,036.93.

The reaction is less contradictory than it first appears. Traders cut the odds of a Federal Reserve rate increase in September, Treasury yields fell across the curve, and equity valuations rose with them. Friday’s move was a valuation response rather than a growth response: a lower expected policy rate reduces the discount rate applied to future corporate cash flows, which raises the present value of those cash flows.
That leaves a more difficult question for the weeks ahead. How much further can hiring weaken before lower rates stop offsetting the drag from slower growth?
The S&P 500 closed at a record 7,757.64 on 7 August despite nonfarm payrolls falling 23,000 in July, against consensus for a gain of roughly 80,000 to 95,000 depending on the survey.
September rate-hike odds fell to about 44% from 55% before the release and 67% a week earlier, per CME FedWatch. The two-year Treasury yield fell four basis points to 4.203% and the ten-year eased to 4.657%.
The headline overstates private-sector weakness. Government payrolls fell 53,000, including a 50,000 drop in local-government education, leaving private payrolls up 30,000.
Wage growth cooled sharply. Average hourly earnings rose just 2 cents to $37.62, taking the annual rate to 3.2%, below the 3.5% forecast and the slowest since May 2021.
Corporate profits gave stocks a cushion. Of the 88% of S&P 500 companies that have reported Q2 results, 86% beat EPS estimates, with blended earnings growth of 50.4%.
The S&P 500 wasn't celebrating lost jobs; it was celebrating a lower chance of higher interest rates.
Before the release, futures pricing implied close to even odds on a September increase, which would have been the Fed’s first hike since 2023. Three Fed officials had voted to raise rates at the most recent meeting. After the payroll miss, the implied probability dropped to about 44%, down from 55% in the prior session and 67% a week earlier.
Short-dated Treasuries, which track Fed expectations most closely, led the move. The two-year yield fell four basis points to 4.203% and was down nearly nine basis points on the week. The ten-year slipped 1.3 basis points to 4.657%. Lower yields raise the present value investors assign to future profits, which helps long-duration growth stocks most and eases the borrowing outlook for smaller companies.
Friday’s returns fit that pattern precisely. The Nasdaq’s 1.30% gain outpaced the S&P 500’s 0.62%, while the Russell 2000 added 1.10% and the Dow lagged at 0.28%.
One detail reinforced the rate story more than the payroll number itself. Average hourly earnings rose 3.2% year over year, below the 3.5% consensus and the weakest reading since May 2021. Slower wage growth removes one of the arguments for tightening into a slowdown.
Payrolls fell 23,000 against a 12-month average gain of just 34,000. The revisions were arguably more significant than the headline: May was cut from 129,000 to 63,000 and June from 57,000 to 20,000, removing 103,000 jobs from previously reported totals. The three-month average now sits near 20,000, a pace consistent with a labour market that has slowed markedly.
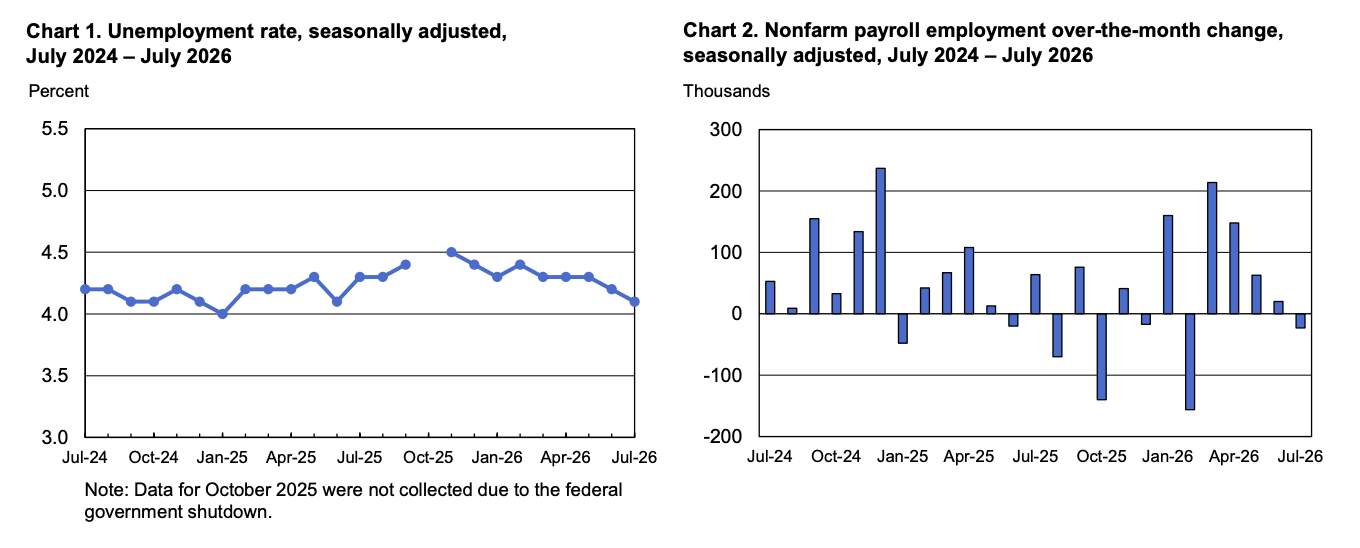
The composition explains why markets could read this as soft rather than broken.
Government: -53,000, with local-government education down 50,000
Private payrolls: +30,000
Leisure and hospitality: -40,000
Retail trade: -19,000
Financial activities: -14,000, now down 121,000 since a May 2025 peak
Health care: +22,000, below its 36,000 twelve-month average
Construction: +22,000
Manufacturing: +5,000
Private employment therefore grew, though on a narrow base. Construction and health care accounted for the gains in a month when leisure and hospitality, retail trade and financial activities all contracted.
These figures warrant some caution. BLS described both payrolls and the unemployment rate as little changed on the month, and its 90% confidence interval for a one-month payroll change is approximately plus or minus 122,000. July’s 23,000 decline may therefore be statistically noisy.
The 103,000 jobs erased from May and June are harder to dismiss, and they are the more reliable guide to the trend.
Because fewer people were participating in the labour market, not because hiring strengthened.
The unemployment rate edged down from 4.2% to 4.1%, which appears contradictory until the two surveys are distinguished. Payrolls come from a survey of employers; the jobless rate comes from a survey of households, and the household measure improved because the labour force shrank.
Participation slipped to 61.4%, down 0.7 percentage point since January, while the employment-population ratio fell 0.5 point to 58.9%. The employment-population ratio fell to 58.9%, down half a point over the same period.
Other household detail points the same way. Temporary layoffs rose 153,000 to 921,000, and the long-term unemployed accounted for 25.5% of all jobless people.
A decline in the unemployment rate driven by labour force exits is a weaker signal than the headline implies, and Fed officials may therefore read the report differently from the market.
Rate expectations alone do not account for a record high set against deteriorating employment data. The second support is corporate profitability, which remains unusually strong.
As of 7 August, data show 88% of S&P 500 companies had reported Q2 results. Of those, 86% beat EPS estimates, against a five-year average of 78%. Aggregate earnings came in 29.2% above estimates, which would be the largest surprise in records going back to 2008. Blended earnings growth stands at 50.4%, the highest since Q2 2021, with revenue growth of 15.0%.
Those aggregates require an important qualification. Alphabet and Amazon inflated them materially through large non-operating investment gains. Excluding both companies, the earnings surprise falls to 10.9% and blended growth to 32.0%, still an exceptionally strong quarter.
Even on that adjusted basis, the quarter marks the seventh consecutive period of double-digit earnings growth, with ten of eleven sectors expanding. Investors are therefore combining softer labour demand and lower yields with corporate earnings that continue to grow at pace.
The trade works only while weaker data cut rate expectations faster than they cut earnings expectations. Three conditions would break it.
1) Private hiring turning decisively negative.
July’s private gain of 30,000 rested on two sectors. If construction and health care were to contract alongside leisure, retail and financial activities, the composition would point to broad-based weakness rather than sectoral rotation.
2) Earnings following employment lower.
The forward twelve-month P/E of 20.0 sits above both the five-year average of 19.9 and the ten-year average of 19.0. Analysts still model 27.4% growth for Q3 and 25.2% for Q4. Valuation at that level depends on those estimates holding.
3) Inflation reviving the hike trade.
This is the immediate test. July CPI arrives on Wednesday, 12 August at 8:30 a.m. ET. June’s reading fell 0.4% month over month, the largest drop since April 2020, pulling annual inflation to 3.5% from 4.2% and core to 2.6%.
Much of that decline came from lower energy prices following the US-Iran ceasefire, a contribution unlikely to repeat at the same scale. A firmer core reading for July would lift yields and September hike expectations again, removing the support that underpinned Friday’s record.
Lower rates lift the multiple investors are willing to pay. They do nothing for the profits that multiple is applied to. The market can tolerate slower hiring while earnings hold up and weaker data keep borrowing costs falling, which is precisely the combination July delivered.
The trade becomes far harder once labour weakness starts reaching revenue, margins and earnings estimates. Wednesday’s CPI settles the first half of that equation, showing whether yields have further to fall. The next few employment and earnings reports settle the second.
U.S. Bureau of Labor Statistics: July 2026 Employment Situation
https://www.bls.gov/news.release/archives/empsit_08072026.htm
U.S. Bureau of Labor Statistics: June 2026 Consumer Price Index
Federal Reserve: July 29, 2026 FOMC Statement
https://www.federalreserve.gov/newsevents/pressreleases/monetary20260729a.htm