Published on: 2025-10-07
Updated on: 2025-10-07

J. Welles Wilder Jr. was the engineer-turned-market analyst who, in his 1978 book New Concepts in Technical Trading Systems, introduced a set of technical indicators — most notably the RSI, ATR, ADX/DMI and Parabolic SAR — that remain fundamental tools for traders and analysts today.
John Welles Wilder Jr. trained as a mechanical engineer and served in the US Navy; his technical education is widely cited as a foundation for the mathematical and systematic approach he later applied to price data.
After engineering and property-development work, Wilder moved into commodity trading and founded Trend Research, Ltd., through which he published his methods and offered seminars.
His best-known book, New Concepts in Technical Trading Systems, was published in 1978 and first described the indicators that bear his name.
Wilder continued to write and speak about markets for decades; his ideas were rapidly adopted by charting platforms and traders worldwide and remain embedded in most modern charting packages.

New Concepts in Technical Trading Systems (1978) introduced a collection of mathematical treatments applied to price-series data. The book established the formulas and practical parameters that traders still use.
The most widely used indicators introduced by Wilder include: Relative Strength Index (RSI), Average True Range (ATR), Directional Movement/Average Directional Index (DMI/ADX), Parabolic SAR, the Swing Index and the Commodity Selection Index (CSI).
These form a compact toolkit addressing momentum, volatility, trend strength and exits.
RSI is a momentum oscillator that measures the speed and magnitude of recent price changes on a scale of 0–100; it signals potential overbought/oversold conditions and momentum divergence.
Wilder recommended a 14-period smoothing (the standard), using a smoothed average of gains versus losses to compute an index that oscillates between 0 and 100.
Common thresholds are 70 (overbought) and 30 (oversold), though experienced traders adjust these by market regime.
Typical signals:
Overbought/oversold crossings (70/30).
Divergences between price and RSI (price makes a higher high but RSI makes a lower high).
"Swing" or failure swings described by Wilder (signal confirmed after the indicator completes a short-cycle pattern).
ATR quantifies market volatility by averaging the "true range" — a value that accounts for the current high/low and previous close — over a chosen period. It does not give direction, only volatility magnitude.
It is commonly used for: position sizing, dynamic stop-loss placement (e.g. multiples of ATR), and identifying volatility breakouts.
It's particularly valuable where gaps or limit moves occur because true range includes gaps.
+DI and −DI measure directional movement; ADX is a smoothed measure of the absolute strength of the trend (direction-agnostic), typically on a 0–100 scale. Readings above ~25 are commonly interpreted as indicating a reasonably strong trend.
How traders use them. Use +DI/−DI crossovers to identify direction and ADX to confirm whether that direction is supported by strength; avoid relying on direction signals when ADX is low (range market).
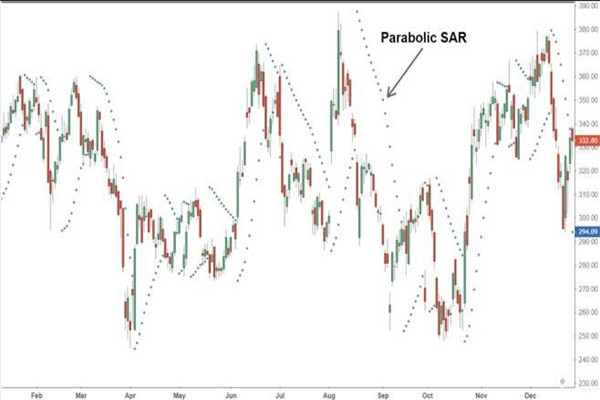
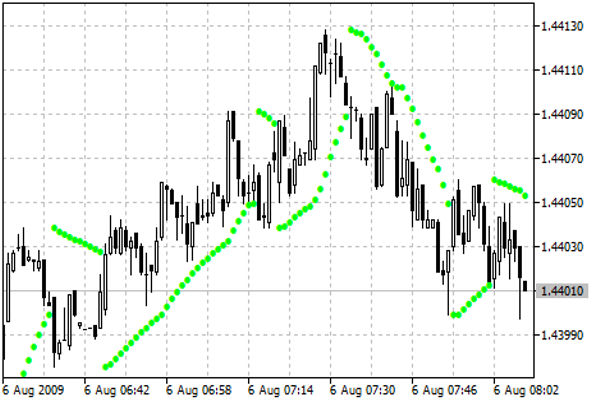
Parabolic SAR places a sequence of dots above or below price to suggest likely trend direction and possible reversal points; it is designed as a trailing stop method for trending markets.
SAR works best in steady trends and may generate whipsaws in range-bound markets; traders often use ADX to filter when SAR signals are reliable.

| Indicator | Main purpose | Typical default | Best market type | Primary practical use |
| RSI | Momentum / overbought-oversold | 14 periods; 70/30 thresholds | Ranging & trending (with caution) | Entry/exit timing, divergences. |
| ATR | Volatility magnitude | 14 periods (commonly) | Any (volatility measure) | Stop placement, position sizing. |
| ADX / DMI | Trend strength & direction | 14 periods; ADX >25 implies trend | Trending markets | Confirm trend, avoid false breakouts. |
| Parabolic SAR | Trailing stop / reversal points | AF start 0.02, step 0.02, max 0.20 | Strong trends | Place trailing stops, reverse signals. |

Step 1: Check ADX; if ADX > 25 (or chosen threshold), treat trend-following signals seriously. If ADX
Rule: set initial stop at 1.5–3 × ATR depending on timeframe and your risk tolerance; tighten with Parabolic SAR as trend progresses.
Example: in a strong uptrend (ADX high, +DI > −DI), treat RSI dips towards 40–50 as buying opportunities; in a downtrend treat RSI rallies toward 60–70 as opportunities to sell/short.
Use ADX to filter: only act on SAR signals when ADX indicates a strong trend.
Embedded in platforms. Wilder's formulas are built into almost every charting package and software library; that ubiquity has made his methods a default starting point for technical-system design.
Extensions and quant use. Quantitative traders and researchers treat Wilder's indicators as features (inputs) for machine learning or as components in algorithmic strategies, often adjusting smoothing, period length, or combining them with price-action filters and order-flow data.
He was a mechanical engineer and market technician who published New Concepts in Technical Trading Systems in 1978 and introduced several indicators still in widespread use.
RSI, ATR, ADX/DMI, Parabolic SAR, Swing Index and the Commodity Selection Index (CSI) among others.
Yes — RSI is widely used as a momentum oscillator — but users should adapt thresholds and context to the asset and timeframe and use RSI alongside trend/volatility filters.
Common practice is to set stops at a multiple of ATR (e.g., 1.5–3× ATR) so the stop adapts to current volatility; always combine with position sizing rules.
In range-bound or choppy markets it often flips frequently and produces whipsaws; using ADX to confirm trend strength reduces false signals.
Practical takeaways about J. Welles Wilder Jr. and his methods
J. Welles Wilder Jr. combined engineering rigour with practical market experience to produce a small set of mathematically defined tools that remain highly influential.
His indicators cover momentum (RSI), volatility (ATR), trend strength (ADX/DMI) and trailing exit logic (Parabolic SAR).
(a) treat indicators as tools, not rules;
(b) combine trend, momentum and volatility measures;
(c) backtest on the relevant asset and timeframe;
and (d) enforce disciplined risk management (position sizing and volatility-adjusted stops).
Disclaimer: This material is for general information purposes only and is not intended as (and should not be considered to be) financial, investment or other advice on which reliance should be placed. No opinion given in the material constitutes a recommendation by EBC or the author that any particular investment, security, transaction or investment strategy is suitable for any specific person.