Published on: 2023-06-05
Updated on: 2024-06-19
Many people mistakenly believe that financial transactions and geometric shapes belong to two completely unrelated categories. However, in technical indicators, geometry can also be used in technical analysis indicators. It is the Parabolic indicatorSar), a technical indicator based on geometry, is used by many traders in trading.
Today we will talk about the "Parabolic SAR indicator", its operating principle, and how to use parabolic indicators in transactions.
The Parabolic SAR indicator, abbreviated as SAR, is translated as a parabolic indicator by J WellesWilder was invented in the late 1970s. It is a leading technical indicator, which shows the trend of market price changes and sends signals when determining the price direction and when the price direction changes. It was introduced in Wilder's book "New Concepts of Technology Trading Systems" and other commonly used indicators, such as the Relative Strength Index (RSI).
In fact, Wilder referred to this method as a parabolic time/price system, and the concept of SAR is as follows:
SAR represents stopping and reversing. This is the point to exit long trading and enter short trading, and vice versa.
-Wilder, JW, Jr. (1978). New Concepts of Technology Trading Systems (p. 8).
Nowadays, parabolic SAR indicators are used as tools to identify market trends and potential reversal points.
The main characteristics of parabolic SAR indicators:
1. It can be easily followed.
2. Use only one standard indicator.
3. The indicator directly sends an entry and exit signal.
4. The indicators have a delayed nature.
5. The risk is high and not always effective.
The operating principle of parabolic SAR indicators and how to determine trends
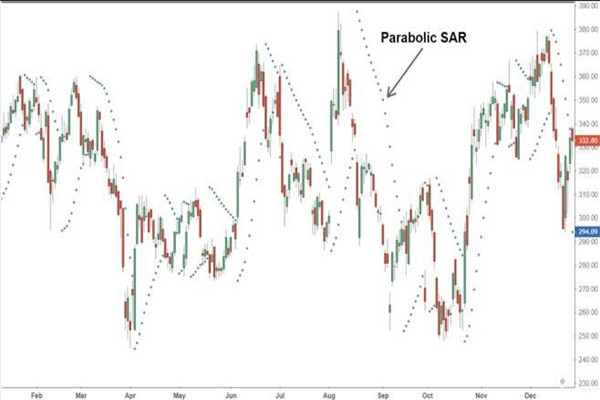
Parabolic SAR indicators consist of dots above or below the market price. The distribution of points forms a parabola, but each point represents a single SAR value.
In short, these points are plotted below prices during an upward trend and above prices during a downward trend. In addition, they were also drawn during the market consolidation period. But in this case, the point will change more frequently from one side to the other. In other words, the parabolic SAR indicator is not very useful in non trend markets. In trend markets, many traders use this indicator for analysis and prediction.

That is to say, when the price is above the parabolic SAR index band point, it indicates that the market is in a strong upward trend at this time. On the contrary, when the price is below the parabolic SAR index band point, it indicates that the market is in a downward trend.
In addition, it should be noted when using this indicator that the parabolic SAR indicator is suitable for use in trend markets. When there is no trend, the advantage of this indicator is not obvious.
Parabolic SAR can provide insight into the direction and duration of market trends, as well as potential reversal points. Therefore, it may increase the probability of traders entering and exiting the market better.
Some traders also use parabolic SAR indicators to determine dynamic stop loss prices, so that their stop loss moves with market trends. This technique is commonly referred to as tracking stop losses.
Essentially, it allows traders to lock in the profits they have already earned, as their positions will be liquidated once the trend reverses. In some cases, it can also prevent traders from closing their profit positions or entering trading prematurely.
As mentioned earlier, parabolic SAR indicators are particularly useful in trend markets, but not during consolidation periods. When there is a lack of clear trends, the indicator is more likely to provide false signals, which may cause significant losses.
A highly volatile market may also provide many misleading signals. Therefore, parabolic SAR indicators often work best when prices change at a more gradual rate.
Another thing to consider is the sensitivity of the indicator, which can be manually adjusted. The higher the sensitivity, the greater the chance of erroneous signals occurring.
Formula for Calculating Parabolic SAR Index
SAR points are calculated based on existing market data. Therefore, to calculate today's SAR, we will use yesterday's SAR, and to calculate tomorrow's value, we will use today's SAR.
In an upward trend, SAR values are calculated based on previous highs. In a downward trend, previous lows will be considered. Wilder refers to the highest and lowest points in a trend as extreme points (EP). However, the relationship between upward and downward trends is not the same.
For an upward trend:
SAR=Previous SAR+AF x (Previous EP - Previous SAR)
For a downward trend:
SAR=Previous SAR – AF x (Previous SAR – Previous EP)
AF represents the acceleration factor. It starts at 0.02 and increases by 0.02 every time the price reaches a new high (upward trend) or a new low (downward trend). However, if the limit of 0.20 is reached, this value will be maintained for the duration of the transaction (until the trend reverses).
In practice, some trading chart masters manually adjust AF to change the sensitivity of indicators. An AF above 0.2 will result in an increase in sensitivity (more reversal signals). If AF is lower than 0.2, the opposite is true. Nevertheless, Wilder stated in his book that a growth rate of 0.02 is generally the most effective.
Although the calculation is relatively simple, some traders may ask Wilder how to calculate the first SAR, as this relationship requires previous values. In his opinion, the first SAR can be calculated based on the last EP before the market trend reversal.
Wilder suggests that traders return their charts to find obvious reversals, and then use this EP as the first SAR value. Then the following SAR can be calculated until the final market price is reached.
For example, if the market shows an upward trend, traders may backtrack for a few days or weeks until they find the previous correction. Next, they will search for the local bottom (EP) of the correction, which can then be used as the first SAR for the next upward trend.
How to use SAR parabolic indicators for effective trading
As an effective trend prediction indicator, SAR parabolic indicator can provide traders with more accurate trend tracking signals. Let's take a look at how to use this indicator for trading.
Using SAR parabolic indicators for long trading, as follows:
Entry point: When the parabolic curve shifts the position from above the price to below.
Stop loss point: The closest support level before the parabolic curve changes position.
Stop earning point: When the price reaches the resistance level formed in the past, you should take profits.
Using SAR parabolic indicators for short trading, as follows:
Entry point: When the parabolic curve shifts the position from below the price to above.
Stop loss point: The closest resistance level before the parabolic curve changes position.
Stop earning point: When the price reaches the support level formed in the past, you should take profits.
Precautions when using SAR parabolic indicators in transactions
1. Combining SAR parabolic indicators with other Trading signals to better improve trading success rates. It is worth noting that, like other indicators, this indicator always has a certain lag compared to price.
2. Do not use SAR indicators for trend reversal trading. This is very risky for your Trading Account.
Although it can be traced back to the 1970s, the parabolic SAR indicator is still widely used today. Traders can apply it to many current markets, such as foreign exchange, commodities, stocks, and cryptocurrencies.
But there is no market analysis tool that can guarantee 100% accuracy. Therefore, before using parabolic SAR or any other strategy, investors should ensure that they have a good understanding of financial markets and technical analysis. They should also have appropriate trading and risk management strategies to avoid inevitable risks.
Finally, because the parabolic SAR indicator does not consider trading volume, it does not provide much information about the strength of the trend. Although larger market trends have led to widening gaps between each point, this should not be seen as a manifestation of a strong trend.
Wilder suggests using the average direction index and parabolic SAR to measure the strength of trends. In addition, moving averages or RSI indicators can be included in the analysis before entry to minimize risks and offset limitations.
EBC Platform Risk Reminder and Disclaimer : There are risks in the market, and investment needs to be cautious. This article does not constitute investment advice.