Published on: 2025-05-05
The Average Directional Index (ADX) is a vital technical analysis tool that helps traders assess the strength of a market trend, regardless of its direction.
Developed by J. Welles Wilder Jr. in 1978, the ADX is part of the Directional Movement System, and traders use it to assess whether a market is trending or ranging.
Moreover, the ADX is widely used across various financial markets, including stocks, forex, and commodities. Thus, understanding and effectively applying the tool can help traders regardless of their preferences.

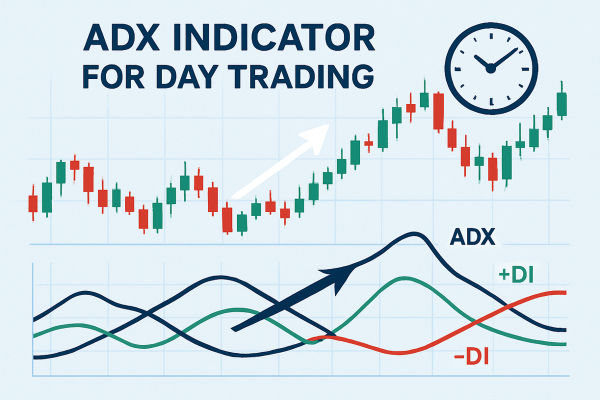
As mentioned, The ADX is a non-directional indicator, meaning it measures the strength of a trend but not its direction. It is typically plotted alongside two other lines: the Positive Directional Indicator (+DI) and the Negative Directional Indicator (-DI). These components work together to provide a comprehensive view of market dynamics:
ADX Line: It shows the strength of the trend. A rising ADX indicates a strengthening trend, while a falling ADX suggests a weakening momentum.
+DI and -DI Lines: Indicate the direction of the trend. When +DI is above -DI, the market is in an uptrend; when -DI is above +DI, the market is in a downtrend.
The ADX value ranges from 0 to 100:
0–20: Weak trend or ranging market
20–40: Moderate trend strength
40–60: Strong trend
60–100: Very strong trend
The calculation of the ADX involves several steps:
1. Calculate Directional Movement (+DM and -DM):
+DM = Current High – Previous High
-DM = Previous Low – Current Low
If +DM > -DM and +DM > 0, then +DM is used; otherwise, it's zero.
If -DM > +DM and -DM > 0, then -DM is used; otherwise, it's zero.
2. Calculate the True Range (TR):
TR is the greatest of:
Current High – Current Low
The absolute value of Current High – Previous Close
The absolute value of Current Low – Previous Close
3. Calculate the Directional Indicators (+DI and -DI):
+DI = (Smoothed +DM / ATR) × 100
-DI = (Smoothed -DM / ATR) × 100
4. Calculate the Directional Movement Index (DX):
DX = (|+DI – -DI| / (+DI + -DI)) × 100
5. Calculate the ADX:
ADX is the smoothed average of DX over a specified period, typically 14 periods

1. Trend Confirmation Strategy
One of the most common uses of the ADX is to confirm whether a trend is worth trading. In this approach, traders look for the ADX to rise above a certain level — typically 20 or 25 — indicating the start of a developing trend. The direction of the trade is then chosen based on which Directional Indicator (+DI or -DI) is above the other.
For example, if ADX rises above 25 and the +DI is above the -DI, it signals a strengthening bullish trend. Traders may look to enter long positions during pullbacks. The opposite holds for a bearish setup, where -DI is above +DI.
This strategy works best in trending markets and helps filter out noise during sideways or range-bound conditions. Stops are typically placed below recent swing lows for long trades or above swing highs for shorts.
2. ADX and Moving Averages Strategy
Moreover, ADX can be combined with moving averages such as the 50-day or 200-day exponential moving average (EMA) to refine trend entries and exits. A strong buy signal occurs when the price is above a key moving average, ADX rises above 20 or 25, and +DI crosses above -DI.
It confirms that the market is trending, the momentum is strong, and the overall price action supports further movement in the same direction.
The moving average serves as a dynamic support or resistance level. Many traders will wait for the price to bounce off the moving average after ADX has confirmed a trend to initiate their positions.
3. ADX Breakout Strategy
Another strategy is to apply ADX in breakout scenarios. In periods of low volatility, the ADX value tends to stay below 20, reflecting a range-bound market. A sudden rise above 20 suggests that a breakout could be underway.
To trade this, monitor price patterns such as triangles, flags, or tight consolidation zones. As ADX rises and the price breaks out of the range, traders can position accordingly. The breakout direction is confirmed by the dominant DI line — long if +DI is above -DI or short if the reverse is true.
This strategy can be effective for traders looking to capitalise on sudden market expansions and avoid false breakouts by waiting for confirmation from the ADX.
4. ADX Pullback Trading
ADX doesn't just help identify new trends; it can also time pullbacks within existing trends. When ADX is above 25, the market is trending, and if the price pulls back to a support level (in an uptrend) or resistance (in a downtrend), it presents a possible entry point.
What makes this more precise is watching ADX during the pullback. When ADX flattens or declines but remains above 20, the trend remains intact. Once the pullback ends and the price resumes in the direction of the trend, traders can re-enter or add to their positions.
This strategy helps avoid entering prematurely and allows traders to catch the continuation of a healthy trend at a better price.
While the ADX is a valuable tool, it has certain limitations:
Lagging Indicator: The ADX is based on historical data, which may provide delayed signals, especially in rapidly changing markets.
Complexity: Calculation and interpreting the ADX can be complex for beginners, requiring a solid understanding of technical analysis.
False Signals: In choppy or sideways markets, the ADX may generate false signals, leading to potential losses if not used cautiously.
Therefore, traders often use the ADX with other indicators and analysis methods to mitigate these limitations.
In conclusion, the Average Directional Index is a powerful tool for assessing trend strength in financial markets. By understanding its calculation, interpretation, and application, traders can make more informed decisions and enhance their trading strategies.
However, like all indicators, it should be used as part of a comprehensive analysis approach, considering other technical and fundamental factors
Disclaimer: This material is for general information purposes only and is not intended as (and should not be considered to be) financial, investment or other advice on which reliance should be placed. No opinion given in the material constitutes a recommendation by EBC or the author that any particular investment, security, transaction or investment strategy is suitable for any specific person.