Published on: 2026-05-29
Costco stock slipped after Q3 earnings on 28 May because the quarter confirmed demand strength but did not expand the earnings story enough to support a premium valuation. The business looked healthy. The stock reaction showed the market wanted more.
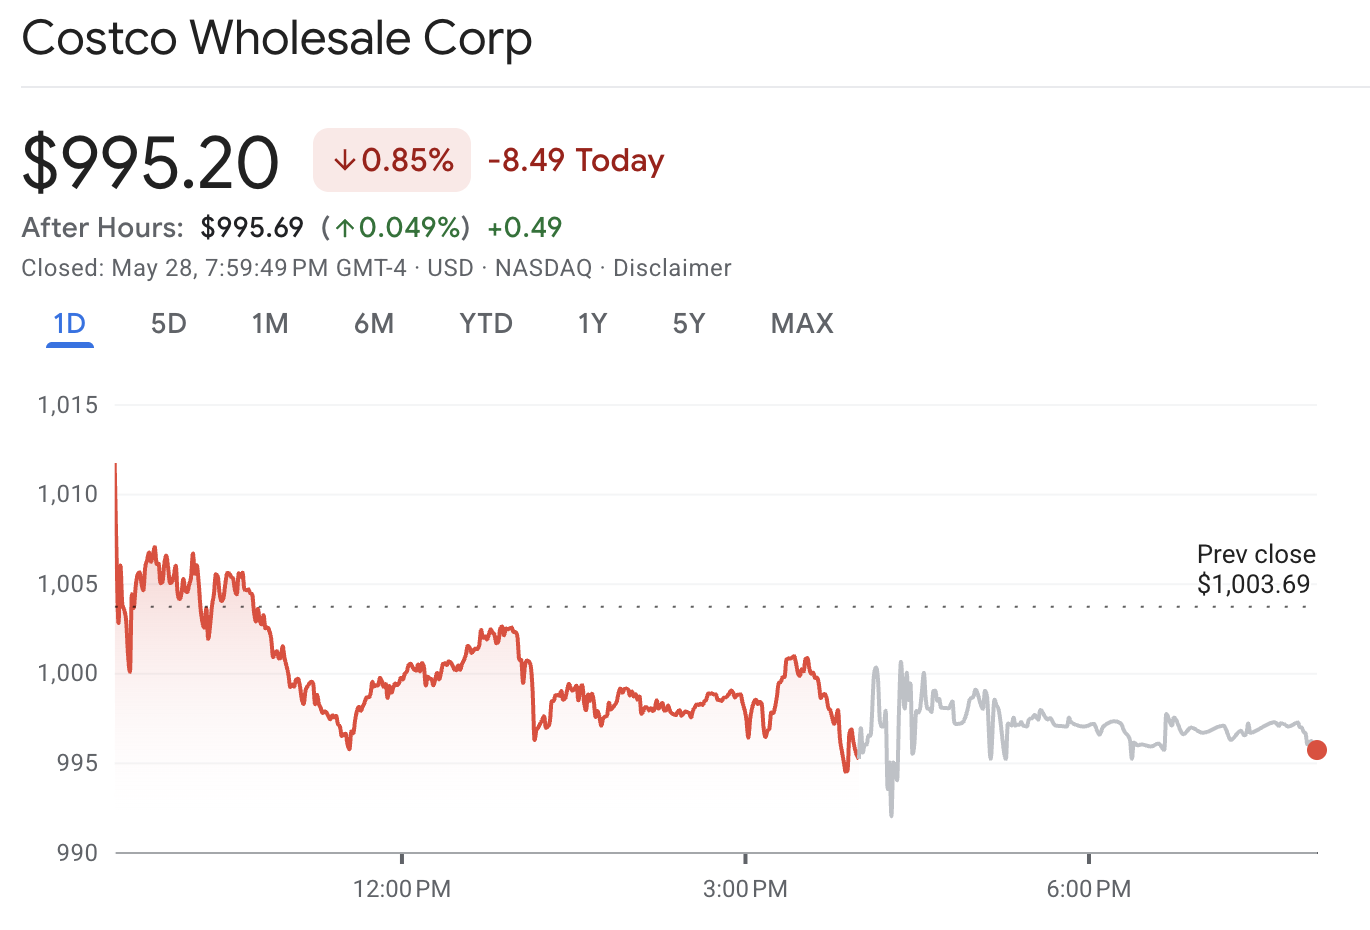
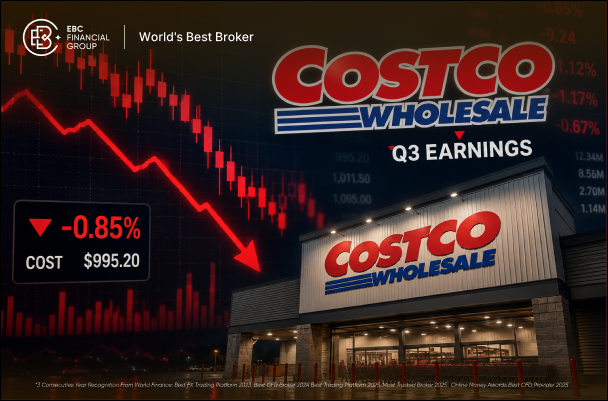
Costco reported another strong operating quarter, with higher sales, rising membership income, firm comparable sales and accelerating digital activity. Yet COST closed around $995.20 on May 29, down 0.85%, after opening above $1,011. At roughly 52x trailing earnings, the stock had little tolerance for a narrow EPS miss, softer reported margins and signs of more normalized membership growth.
Costco stock slipped despite strong Q3 sales, showing that the market reaction was driven more by valuation discipline than by concern over consumer demand.
Net sales rose 11.6% to $69.15B, while total revenue reached $70.53B, confirming that warehouse demand, gasoline sales, and member spending remained resilient.
Diluted EPS increased to $4.93 from $4.28, but the figure landed slightly below the $4.98 consensus estimate cited by market trackers.
Comparable sales rose 9.8%, but adjusted comparable sales increased 6.6% after excluding gasoline-price and foreign-exchange effects, giving a cleaner but less spectacular view of underlying demand.
Membership fee income rose 10.7% to $1.37B, with paid memberships reaching 82.9M and the U.S. and Canada renewal rate holding at 92.2%.
Digitally enabled comparable sales jumped 21.5%, but digital remains a growth enhancer rather than a near-term driver of consolidated earnings power.
Costco reported net sales of $69.15B for the 12 weeks ended May 10, 2026, up 11.6% from a year earlier. Total revenue reached $70.53B, including $1.37B in membership fees. Net income rose to $2.19B, or $4.93 per diluted share, compared with $1.90B, or $4.28, a year earlier.
The company-confirmed figures were strong. The market comparison was less clean. Market trackers cited consensus EPS at $4.98, implying a $0.05 miss, while revenue topped the cited estimate of $69.68B. That split explains the stock’s muted reaction: revenue beat, earnings quality lagged.
| Metric | Q3 FY2026 Result | Interpretation |
|---|---|---|
| Net sales | $69.15B | Up 11.6% year over year |
| Total revenue | $70.53B | Above cited market estimates |
| Diluted EPS | $4.93 | Up 15.2% year over year, slightly below cited consensus |
| Total comparable sales | +9.8% | Strong headline demand |
| Adjusted comparable sales | +6.6% | Cleaner read excluding gas and FX |
| Digitally enabled comps | +21.5% | Digital growth remains a major support |
| Membership fee income | $1.37B | Up 10.7% year over year |
Gasoline was central to the quarter. Management said all three four-week fiscal periods set successive company records for gas volume, with the final five weeks becoming Costco’s top five volume weeks ever. Higher fuel prices and consumer price sensitivity helped drive traffic to Costco gas stations.
That helped headline sales. It also made the quality of the sales mix more complicated.
Reported comparable sales rose 9.8%, but adjusted comparable sales rose 6.6% after excluding gasoline-price and foreign-exchange effects. Management said foreign exchange added about 1 percentage point to sales, while gasoline inflation added about 2.2 percentage points. Traffic increased 2.4%, while average ticket rose 7.3%, or 4.2% excluding gas and FX.
The margin picture reflected the same mix issue. Gross margin was 11.04%, down 21 basis points from a year earlier. Excluding gasoline inflation, gross margin was up only 1 basis point. Core margins fell 46 basis points on a reported basis and 29 basis points excluding gas inflation, with management pointing to lower margins in fresh, food and sundries, plus deliberate price investments in everyday items such as eggs and beef.
For Costco, gasoline is strategically useful. It reinforces the membership value proposition and increases customer engagement. For COST stock, gasoline-led sales growth receives a lower multiple when it does not carry through clearly to earnings leverage.
Membership fee income rose 10.7% to $1.37B. Paid memberships reached 82.9M, up 4.1%, while total cardholders rose to 148.5M. The worldwide renewal rate held at 89.7%, while the U.S. and Canada renewal rate reached 92.2%. Executive members represented 75% of sales.
Those numbers still separate Costco from most retailers. The membership model creates recurring income, strengthens loyalty and gives Costco more room to price aggressively on merchandise.
The nuance is growth normalization. Management described 4% to 5% membership growth as a more normal rate when Costco is not benefiting from unusual events such as major new-market entries or pandemic-era behavior. That is not a warning sign. It is a reminder that Costco’s membership base is now very large, and large bases compound more slowly.
Digital was one of the cleanest positives in Q3. Digitally enabled comparable sales rose 21.5%, or 20.8% adjusted for currency. Site and app traffic increased 37%, with strength across pharmacy, gold and jewelry, home furnishings, tires, housewares and major categories.
Costco also gave a more specific technology update. Personalized product recommendation tools delivered conversion rates roughly three times typical rates and contributed just under $500M of e-commerce sales. Management also said AI-search traffic grew at a triple-digit rate and carried the highest conversion rate of any site traffic source, while noting that volume remains low.
That distinction is important. The AI disclosure is a directional positive, not yet a material earnings driver. The stronger story is that Costco is using digital tools to deepen member engagement without abandoning the warehouse model.
Based on market data from May 29, COST traded around $995, with a market value near $442B and a trailing P/E near 52x. That multiple assumes sustained comp growth, stable membership economics, margin discipline and continued international expansion. It also leaves little room for results that are merely strong rather than stronger than expected.
Q3 did not weaken the long-term case. It did not meaningfully advance it either.
Revenue growth was robust, membership income expanded and digital sales accelerated. But the quarter also included a small EPS miss against cited estimates, reported gross margin pressure, gasoline-driven sales mix, and membership growth moving toward a steadier pace. For a stock priced near perfection, that combination was enough to trigger valuation discipline.
The next test is whether Costco can turn strong demand into clearer earnings leverage. Four metrics deserve priority:
Core margin trajectory: whether price investments remain contained or weigh further on merchandise profitability.
Membership growth: whether paid memberships hold around the normalized 4% to 5% range.
Gasoline mix: whether merchandise-led sales can offset a lower-margin fuel contribution.
Digital profitability: whether e-commerce growth begins to contribute more visibly to consolidated earnings.
Costco’s Q3 results did not show a demand problem. They showed a valuation problem. Consumers continue to reward the warehouse model, but COST stock already reflects a high degree of confidence in that model.
The market reaction was therefore rational. Costco delivered a good quarter. At more than 50x earnings, good was not enough.
Costco’s Q3 FY2026 results showed a business still executing well, with strong sales growth, resilient traffic, durable membership income, and fast digital expansion.
The stock reaction was driven by valuation, not weak demand. At more than 50x earnings, COST needed more than solid results. A small EPS miss, reported margin pressure, and gasoline-driven sales mix were enough to keep the stock under pressure.
Costco Investor Relations: Q3 FY2026 Earnings Release
https://investor.costco.com/news/default.aspx
Costco Investor Relations: Q3 2026 Earnings Call / Events & Presentations
https://investor.costco.com/events-and-presentations/default.aspx
Costco Investor Relations: SEC Filings / SEC EDGAR
https://investor.costco.com/financials/sec-filings/default.aspx
Financial figures are based on Costco’s fiscal Q3 2026 earnings release and earnings call commentary dated May 28, 2026. Market estimates are based on third-party consensus data reported by financial media. Stock price, market capitalization, and valuation figures reflect market data available on May 29, 2026.