Published on: 2026-07-13
GBP/EUR is pressing against 1.175, its best level in a year, and the reason is less flattering than the chart suggests. Sterling is being paid a premium for an inflation problem the Bank of England has not yet solved, and the same energy shock reinforcing that premium could hollow out the growth needed to justify it.
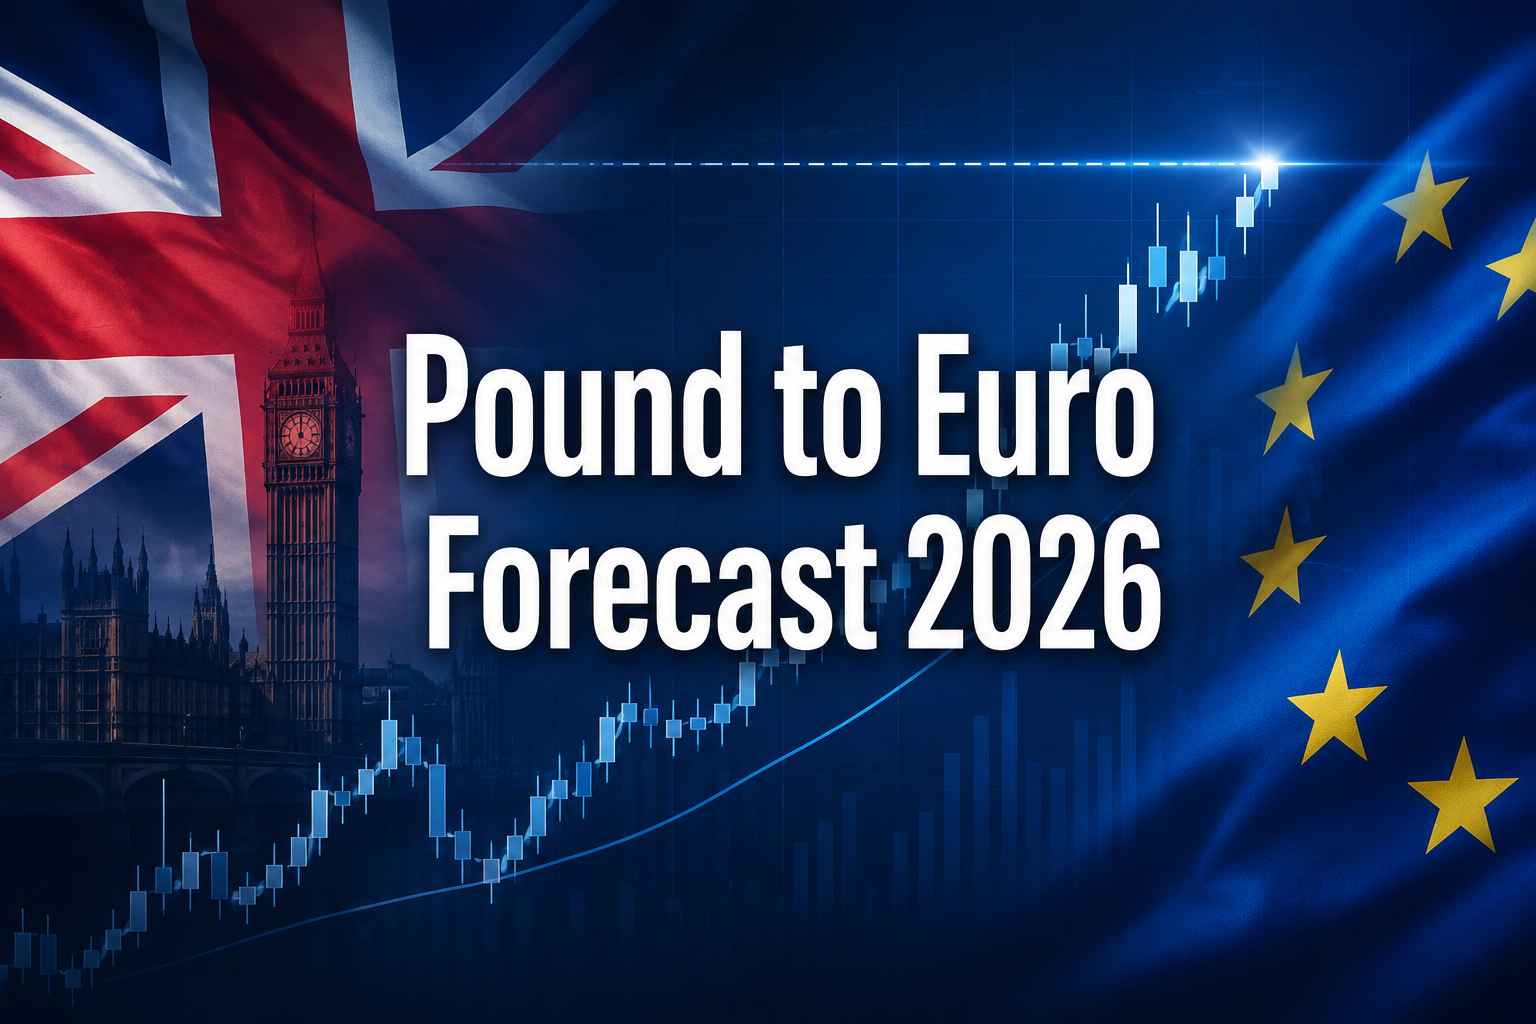
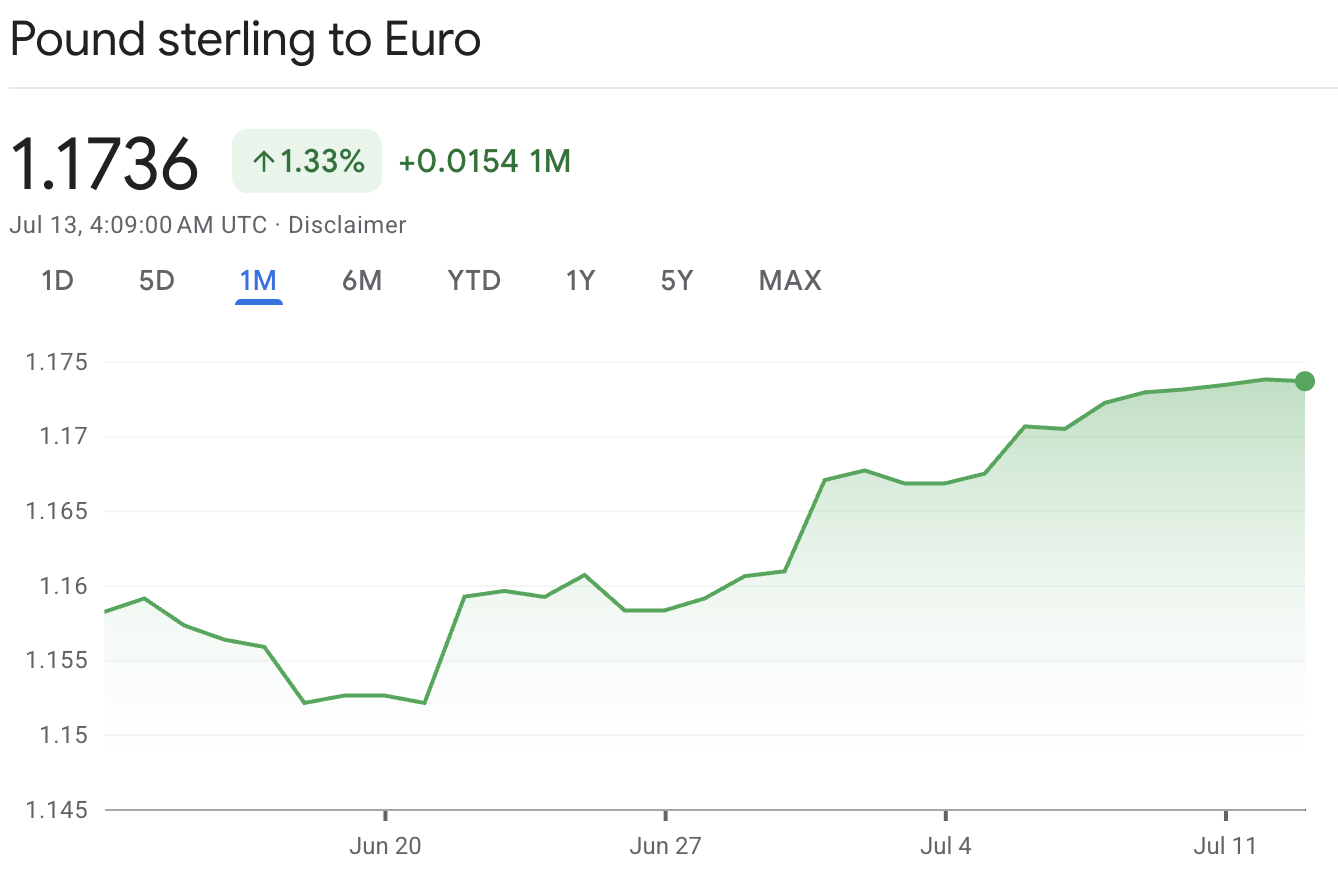
GBP/EUR set a one-year intraday high of 1.1752 on 10 July, making 1.175 the line that defines the rally.
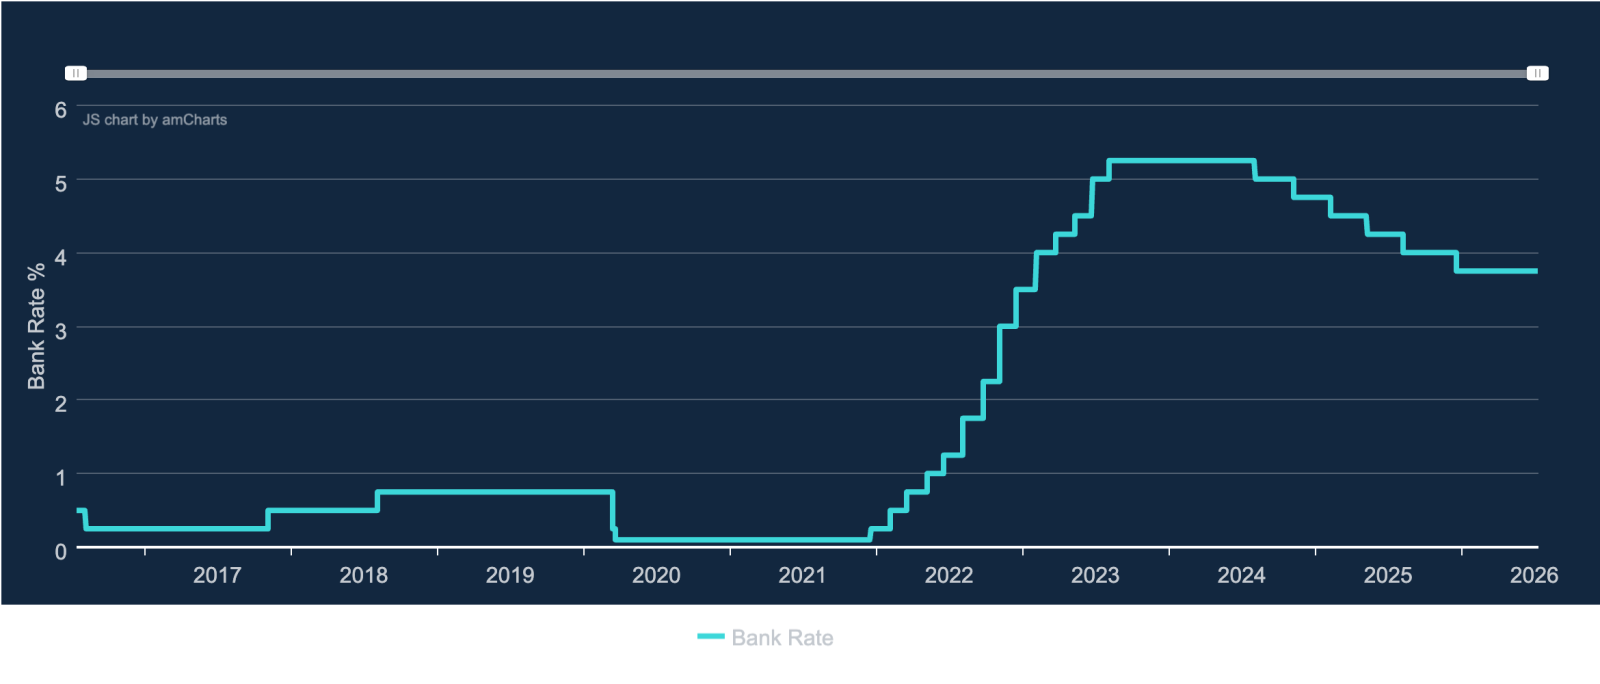
Bank Rate sits at 3.75% versus the ECB’s 2.25% [1][2], a 150-basis-point cushion the market has known for weeks.
Higher oil supports the case for restrictive UK policy while raising the risk of weaker spending and thinner margins.
A data cluster, 16 July GDP, 21 July jobs and 22 July inflation [3], tests whether growth and prices can sustain the rate path priced into the pound.
A confirmed break opens 1.1800, then 1.1830-1.1850; failure leaves 1.1680 and 1.1600 in focus.
The cleanest currency rallies are funded by growth: rising investment, improving productivity, widening returns on capital. Sterling’s is funded by something more awkward, the market’s belief that UK inflation is stubborn enough to stop the Bank of England cutting.
The numbers frame the trade. The BoE held Bank Rate at 3.75% on 18 June in a 7-2 vote, with two members pushing for a hike to 4% [1]. The ECB moved the other way, lifting its deposit rate to 2.25% on 11 June in its first increase since 2023 [2].
That leaves a 150-basis-point gap, a sizeable UK versus euro-area policy difference, and it is why short-dated sterling assets out-yield their euro-area equivalents.
The catch is what the gap represents. UK services inflation, which rose to 3.7% in May [3], is the reason the BoE cannot relax, while euro-area headline inflation, estimated at 2.8% in June with core at 2.4% on the flash reading [4], gave the ECB less reason to tighten aggressively.
Sterling is winning a relative-inflation contest, not an economic one, and the rally holds only while UK price pressure stays firm enough to defend the yield advantage and UK activity stays firm enough to keep that stance believable. Lose the first and the rate case fades; lose the second and another hike becomes impossible.
Renewed US-Iran tension and the threat to Strait of Hormuz shipping have pushed energy prices up and reintroduced supply risk the market had largely written off. For the pound, that cuts both ways, and the sequence matters.
The first-order effect flatters sterling. Costlier oil feeds transport, production and household energy bills, and with UK inflation already sticky, it lengthens the odds against near-term cuts and keeps a further hike on the table. A more restrictive expected path can, all else equal, support sterling against the euro.
The second-order effect works against it. Britain is a substantial net energy importer, leaving households and companies exposed to a sustained rise in global oil and gas costs that drains real household income, softens consumption and compresses corporate margins.
Currencies often climb through the early, inflationary phase of an oil shock and surrender the gains once the hit to activity reaches the data. That lag is the risk sitting under 1.175: the breakout holds only if oil stays high enough to support rate expectations without visibly denting UK output, a balance that rarely lasts.
May GDP lands on 16 July alongside services, industrial production, construction and trade [3]. It is the next major hard-data test of whether the economy can bear the rate path the pound is leaning on.
The bullish outcome is breadth. Solid services output would show domestic demand can absorb restrictive rates, while steady industrial and construction figures would ease the worry that growth leans on a single sector, making the BoE’s hawkish minority easier to defend.
A weak print does the opposite, turning the oil story from a rate story into a growth story: if output stalls, the case for another hike weakens regardless of energy prices, and the market starts pricing eventual cuts.
The backdrop remains modest, with the IMF forecasting UK growth of 1.0% for 2026, an upgrade from 0.8%, even after first-quarter GDP rose 0.6% quarter on quarter [5]. The pound has been rewarded for expectations that were merely less bad than feared, not for real momentum.
GDP is only the opening act. UK labour-market figures on 21 July and June inflation on 22 July [3] will decide whether the BoE’s hawkish minority has the evidence to argue for another increase, and the inflation print carries the most weight of the three: the entire sterling thesis rests on prices staying persistent enough to justify restrictive policy.
Part of sterling’s resilience is the quiet on the political front. The pound tends to lurch when markets doubt UK fiscal credibility, and lately there has been no such shock: the anticipated Labour leadership handover, paired with commitments to retain the existing fiscal rules, has helped contain the immediate political risk premium and let rate and inflation expectations drive the pair.
That support is passive, reflecting the absence of a new problem rather than a structural improvement.
High borrowing costs still leave the gilt market sensitive to any fiscal wobble, and slower growth would shrink the room to absorb spending or revenue surprises. Reduced political noise helped carry GBP/EUR to 1.175; it cannot push much beyond it alone.
An intraday move above 1.1752 would not by itself confirm a sustained breakout. Confirmation takes four things: a daily close above the one-year high, a successful retest that turns old resistance into support, corroboration from UK data rather than a one-off oil spike, and restrained ECB repricing so the euro side does not close the gap.
Clear all four and 1.1800 comes into view as the next forecast zone, with 1.1830-1.1850 above it. Fail, and the pair drops back into range, where 1.1680 is first support and 1.1600 the more serious test below it.
Some banks remain sceptical about a durable breakout: MUFG’s 3 July forecasts imply GBP/EUR near 1.14 in the fourth quarter, while earlier Nomura research pointed to a more bearish level near 1.12. These are individual forecasts, not a market consensus, which is itself widely split.
Everything above collapses into three paths, separated less by the GDP headline than by its breadth and by what the ECB does next.
| Scenario | Trigger | GBP/EUR zone | Read-through |
|---|---|---|---|
| Growth carries the rate shock | Resilient GDP, firm services, hawkish BoE pricing | 1.1780-1.1850 | Yield advantage finally earns economic backing |
| Inflation holds, growth wavers | Mixed GDP, high oil, little policy repricing | 1.1680-1.1770 | Rates support the pound, but weak growth caps it |
| The stagflation trade cracks | Broad UK weakness or hawkish ECB repricing | 1.1580-1.1680 | Growth fears override the yield story |
The middle path is the market’s default and the likeliest into 30 July. The tails are cleaner: broad strength earns the breakout, while broad weakness alongside a hawkish ECB tilt turns the stagflation trade against sterling.
The Bank of England’s decision on 30 July [1] is the next pivot, and the vote arithmetic may say more than the rate itself.
Another pair of dissents for a hike would show the hawkish wing is alive, and the guidance will matter as much as the tally: whether the BoE treats the oil move as a persistent inflation threat or a shock to absorb without more tightening.
A committee anxious about prices but increasingly wary of growth may simply be unable to deliver the path the pound is counting on.
In the short run, yes, by reinforcing expectations of tighter BoE policy. The effect reverses once elevated energy costs start eroding UK growth.
Weak GDP, fewer BoE hike expectations, a hawkish ECB tilt, falling oil or renewed fiscal worry would each undercut a sustained break.
The euro cross isolates the story that matters now: UK versus euro-area rates, inflation and growth. GBP/USD muddies it, since the dollar is driven by the Federal Reserve and global risk appetite, so a move there can say more about the US than about sterling.
GBP/EUR can clear 1.1752, but only through a narrow gate. UK inflation has to stay hot enough to protect the pound’s yield edge while growth stays sturdy enough to keep that stance credible, and the July data run is where those two conditions meet reality.
Resilient figures argue for the 1.1800-1.1850 zone; soft ones expose how much of this rally has leaned on rate expectations manufactured by an inflation problem rather than by strength. The pound is near a new high because the market believes Britain can hold higher rates for longer. The next leg depends on whether the economy agrees.
That verdict will not arrive in a single release. The 16 July GDP figures, the 21 July labour report, June inflation on 22 July and the 30 July Bank of England decision each feed the same question, and all four can be followed through EBC’s economic calendar.
Bank of England, Bank Rate and latest monetary policy decision.
https://www.bankofengland.co.uk/monetary-policy/the-interest-rate-bank-rate
European Central Bank, Monetary policy decisions, 11 June 2026.
https://www.ecb.europa.eu/press/pr/date/2026/html/ecb.mp260611~4d41bd5e83.en.html
Office for National Statistics, UK economic statistics and release calendar (GDP, labour market and consumer price inflation).
Eurostat, European Commission, Euro area annual inflation, June 2026 flash estimate.
https://ec.europa.eu/eurostat/web/products-euro-indicators/w/2-01072026-ap
International Monetary Fund, United Kingdom: 2026 Article IV concluding statement.