Published on: 2026-06-01
Updated on: 2026-06-01
If you’ve been watching the stock market today, you already know that the bulls are flatly refusing to give up the steering wheel. Wall Street pushed even deeper into unchartered territory as the major averages extended their record-breaking run, capping off a historic month of gains. Huge waves of big-money inflows and an unyielding appetite for artificial intelligence infrastructure continue to shield stocks from broader economic headaches, keeping the market's main bullish trend firmly intact.
By the closing bell, the benchmark S&P 500 locked in its seventh consecutive positive session and its ninth straight winning week. That marks the longest weekly winning streak we’ve seen since the final days of 2023. Once again, a handful of tech giants acted as the market's heavy lifters, doing enough heavy lifting to completely mask a painful wave of selling across retail, grocery, and consumer stocks.
While messy geopolitical headlines and stubbornly high Treasury yields kept smaller companies grounded, the major growth indexes simply shrugged off the macro pressure to clock fresh all-time highs.

The real story dominating the stock market today is the staggering gap between the tech elite and everyone else. The tech sector alone surged over 15% throughout the month, while traditional corners of the economy basically flatlined or fell backward.
S&P 500: 7,580.06 (+0.2%)
Dow Jones: 51,032.46 (+0.7%)
Nasdaq: 26,972.62 (+0.2%)
A jaw-dropping earnings report from the hardware space provided the fuel for Friday’s late-day chase. Dell Technologies (DELL) sparked a massive industry-wide frenzy, skyrocketing 32.8% to close at $420.91. The company blew past Wall Street's profit targets and hiked its financial forecasts, pointing to an insatiable demand for high-end AI servers. Dell revealed a massive backlog of $24.4 billion in unfilled AI orders and estimates its enterprise server revenue could touch $60 billion by fiscal 2027.
That single report sent a massive shockwave of buying through rival infrastructure stocks:
Hewlett Packard Enterprise (HPE) jumped 12.7% as traders tried to get ahead of its upcoming earnings release.
Super Micro Computer (SMCI) caught a major tailwind, locking in an 8.6% intraday gain.
Microsoft (MSFT) climbed 5.4%, adding billions to its market valuation as big corporations keep spending heavily on cloud computing.
Broadcom (AVGO) tacked on 4.7% ahead of its own highly anticipated quarterly update.
It wasn't a universal party in tech, though. Nvidia (NVDA) actually dragged its feet, losing steam as traders took a breather after its monster multi-month run. Meanwhile, Amazon (AMZN) slipped 1.2% as money actively rotated away from e-commerce platforms and poured straight into raw hardware.
Step outside of the tech bubble, and the stock market today felt like a completely different world. Brands that rely on everyday consumer spending took a severe beating as a string of corporate updates revealed that shoppers are finally hitting a wall and margins are getting squeezed tight.
Clothing retailers caught the worst of it. Gap Inc. (GAP) cratered 15% even though its initial earnings numbers looked decent. Investors aggressively dumped the stock after executives lowered their full-year sales outlook, admitting to a sudden and pronounced slowdown in their core women’s apparel lines.
At the same time, American Eagle Outfitters (AEO) collapsed 11% following a blunt disclosure that sales at its flagship stores dropped 2% compared to last year.
DELL: +32.8% (Record AI Server Demand)
MSFT: +5.4% (Enterprise Cloud Inflows)
COST: -3.9% (Margin Compression / EPS Miss)
GAP: -15.0% (Trimmed Full-Year Sales Guidance)
Even the defensive giants weren't safe. Costco Wholesale (COST) shed 3.9% after missing quarterly profit expectations by about five cents a share. Even though the wholesale club posted a decent 6.6% increase in same-store sales, systematic selling took over. Traders are clearly sweating over rising supply chain expenses and a slight thinning of Costco's usually ironclad profit margins.
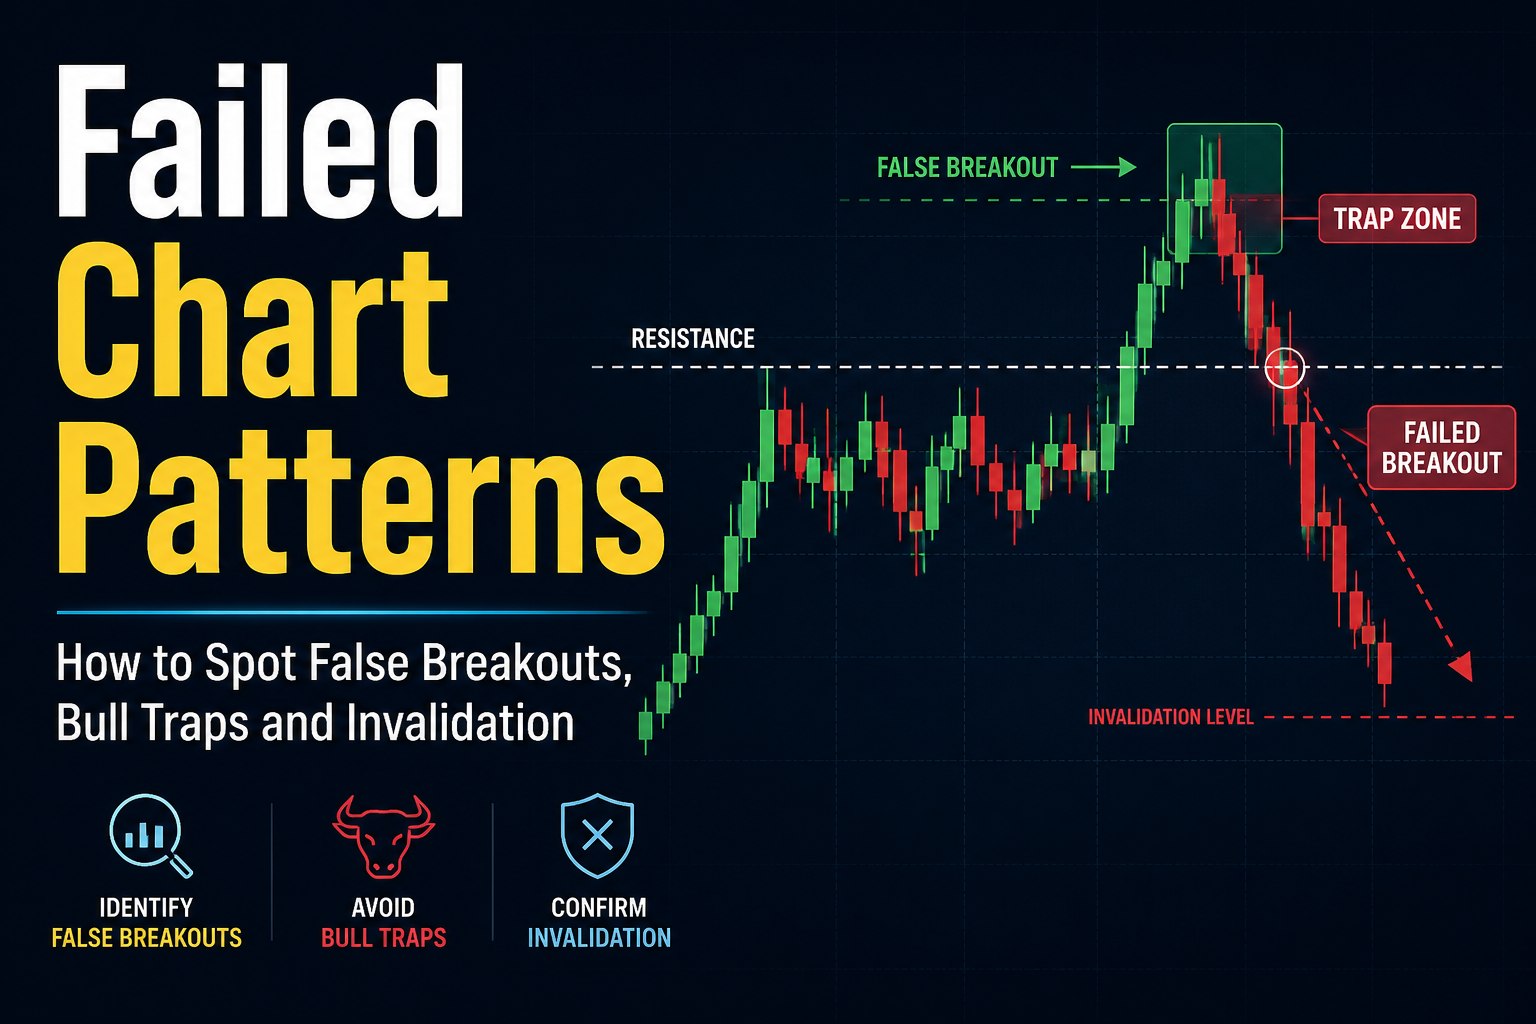
Looking at the charts, the stock market today is screaming "momentum melt-up," but a few warning lights are starting to flash for technical traders.
The S&P 500's close at 7,580.06 marks its fourth straight daily record. The index is trading way above its 50-day and 200-day moving averages, which tells you the bullish trend is incredibly healthy from a structural standpoint. That said, the 14-day Relative Strength Index (RSI) has pushed up past 74. In other words, the market is deeply overbought, a state that usually gives way to a sharp bout of profit-taking or a long sideways grind.
| Asset / Index | Closing Price | First Floor (Support) | Major Floor (Support) | Ceiling (Resistance) | Current Chart Condition |
| S&P 500 | 7,580.06 | 7,500.00 | 7,275.00 | 7,600.00 | Overbought / High Momentum |
| Nasdaq Composite | 26,972.62 | 26,500.00 | 25,800.00 | 27,200.00 | Extended on Tech Buying |
| 10-Year Treasury Yield | 4.44% | 4.35% | 4.20% | 4.52% | Hanging Out near Recent Highs |
The immediate target for the S&P 500 is the big psychological level at 7,600. If bad news hits and traders decide to cash in their chips, the first line of defense is 7,500. If that breaks, a much bigger safety net sits around the 7,275 mark, where big institutions have historically stepped in to buy the dip.
The real catch right now is market participation. While the giant capitalization-weighted indexes are making headlines, the smaller companies are getting left behind. The small-cap Russell 2000 actually dropped 0.6% to 2,919.34. This divergence shows just how much this historic rally is leaning on a very small group of massive tech balance sheets.
While stock traders were busy cheering new highs, the bond and commodity markets were dealing with a lot of noise. The broader economic backdrop for the stock market today is still tied up in the U.S.-Iran friction, which has messed with shipping lanes in the Strait of Hormuz and kept energy prices uncomfortably high.
We did get a breather late in the week, though. Rumors hit the floor that diplomats are looking over a draft for a 60-day ceasefire, which instantly took the air out of the oil market.
Brent Crude fell 1.7% to settle at $91.12 a barrel.
WTI Crude dipped down to $87.36.
Even with that drop, oil is still way more expensive than the $70 baseline we saw back in February, which acts as a quiet tax on corporate supply chains and everyday drivers.
That pullback in oil gave bonds a break. The 10-year Treasury yield settled down slightly at 4.44%. High yields are usually poison for stock valuations, but corporate America's earnings have been so shockingly good that investors are ignoring it. Numbers show that overall earnings growth for the S&P 500 is running at a massive 28% for the quarter.
Because companies are making so much money, Wall Street is successfully tolerating a tough Federal Reserve. The Fed's favorite inflation metric just clocked its highest reading in three years, killing off any remaining hope for interest rate cuts anytime soon. Looking at the CME FedWatch tool, the bond market is betting the Fed will hold rates exactly where they are at the June meeting and keep them there for the rest of the year.
What the stock market today proved is that as long as tech earnings keep delivering explosive growth, stock prices can completely break away from interest rate worries and geopolitical drama. The S&P 500 walked away from the month with a beautiful 5.1% gain, pushing its gains for the year up to 10.7%.
Looking down the road, keeping this bullish trend alive is going to require more than just a few tech stocks doing all the work. With retail showing clear signs of consumer exhaustion and tech valuations looking pretty stretched, we could easily see some sharp pullbacks if the incoming economic data turns sour. Over the next few days, institutional investors will be glued to the upcoming manufacturing data and the latest jobs report to see if the rest of the economy can start catching up to tech.