Published on: 2026-07-20
Price has spent several sessions compressing inside a triangle. Near the lower boundary, a bullish engulfing candle appears. The triangle and the engulfing candle are not competing signals. They describe two different layers of the same chart.
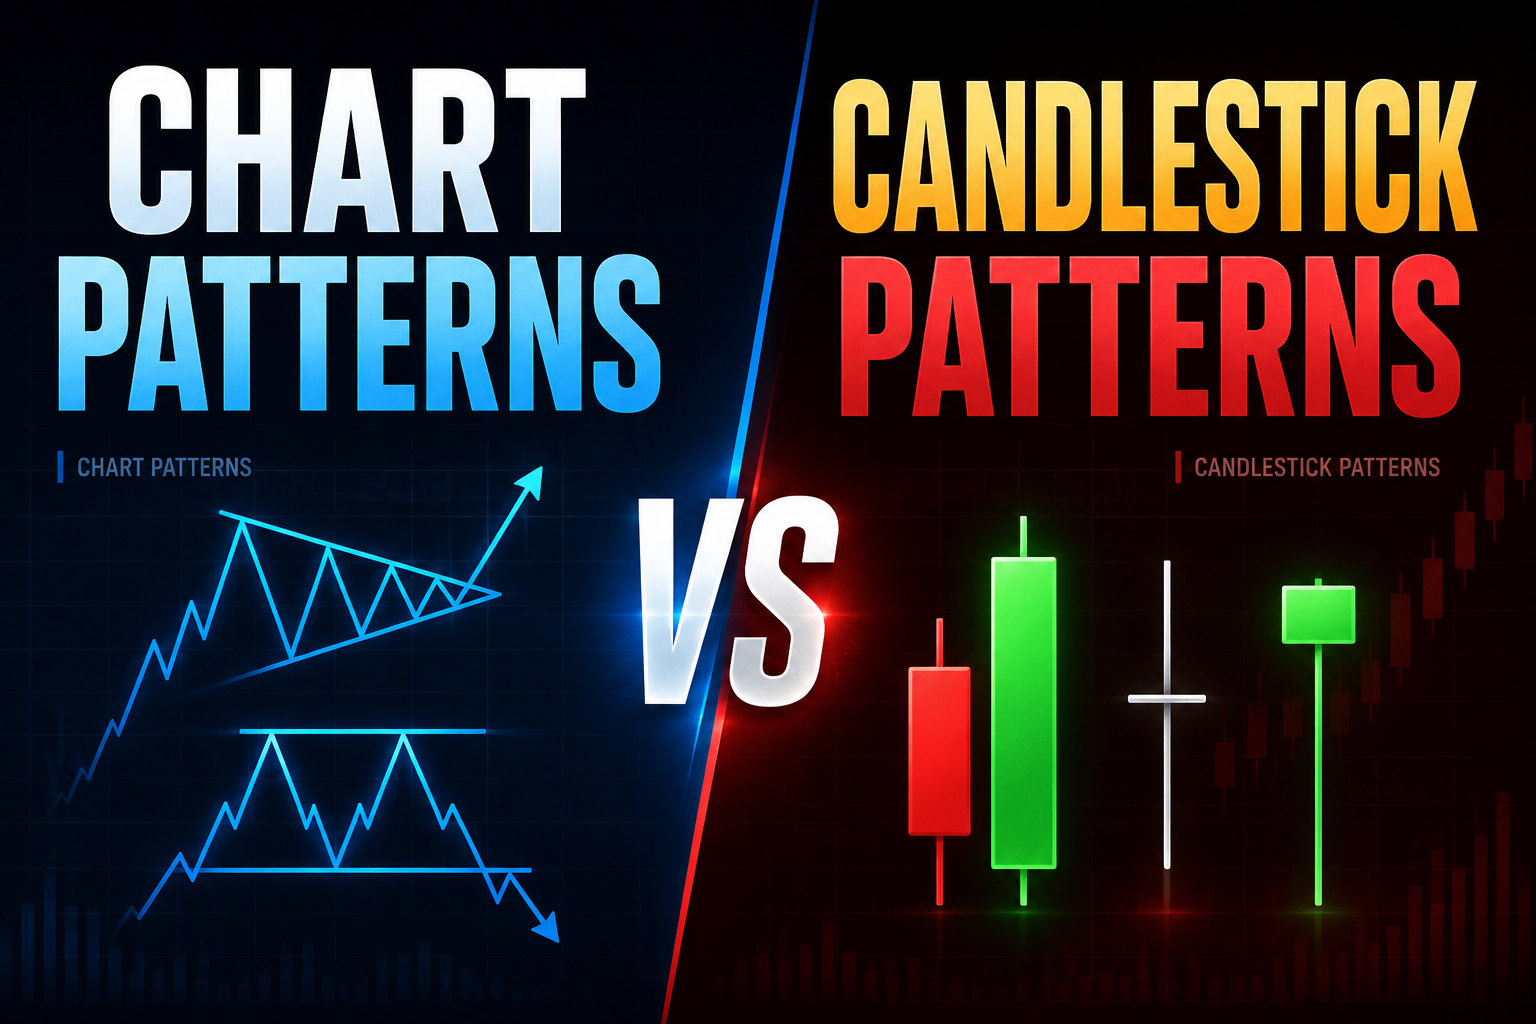
A chart pattern develops across many candles and several price swings. A candlestick pattern forms from one candle or a short sequence of candles. The wider structure shows where price is trading. The latest candles show how buyers and sellers reacted there.
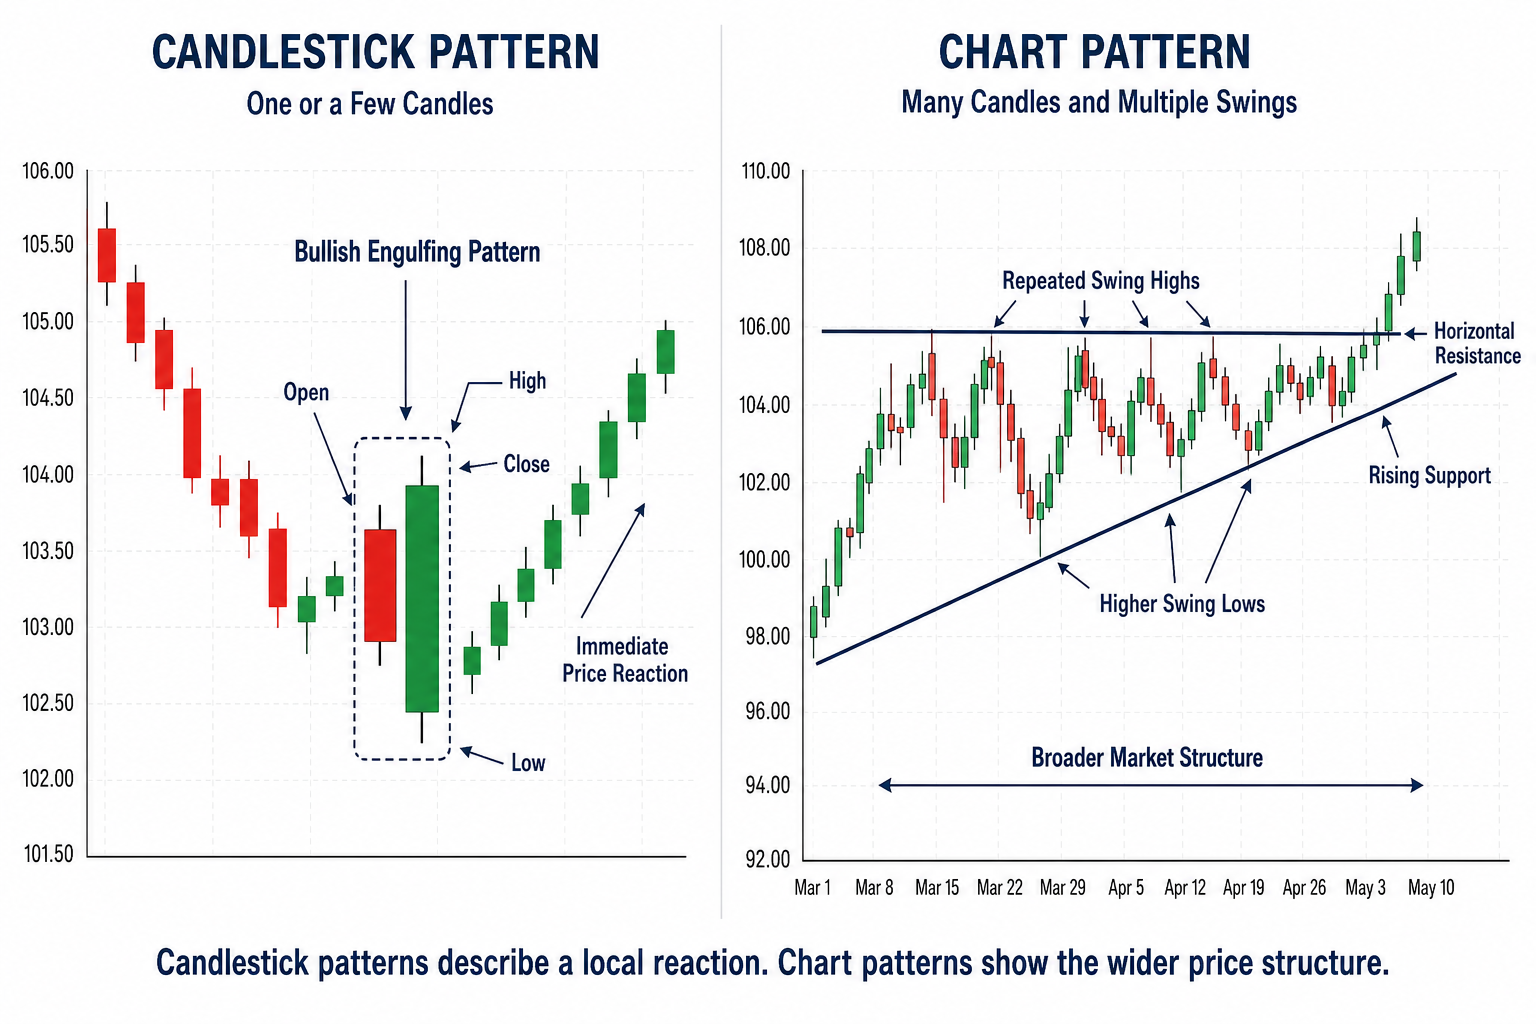
Candlestick patterns form from one or a few adjacent candles. Chart patterns develop across many candles and multiple price swings.
Chart patterns are built from support, resistance, swing highs, swing lows and trendlines.
Candlestick patterns use the open, high, low, and close of individual periods, as well as the bodies and wicks.
Both can appear on any timeframe. Candle count and chart timeframe are separate issues.
A candlestick reaction does not confirm a larger chart pattern. The breakout, breakdown or invalidation level still decides whether the broader structure is working.
| Feature | Candlestick Patterns | Chart Patterns |
|---|---|---|
| Formation | One or a few adjacent candles | Many candles and several price swings |
| Main inputs | Open, high, low, close, body and wicks | Swing highs, swing lows, support, resistance and trendlines |
| Main use | Read the latest reaction at a price level | Map the wider structure and its boundaries |
| Examples | Hammer, doji, engulfing pattern, morning star | Triangle, flag, double top, double bottom, head and shoulders |
| Confirmation | Follow-through in the expected direction or a break of a relevant formation level | A close beyond a trendline, neckline or range boundary |
| Invalidation | Price moves through the opposite end of the formation | Price breaks back through the level supporting the chart idea |
| Main weakness | Common patterns can appear without useful context | Traders may draw the structure too early or force it onto random movement |
A candlestick chart is a display method. Each candle records price movement during one selected period.
A candlestick pattern is a formation within that chart. A chart pattern is the larger shape created as price moves across many candles.
A candlestick pattern forms from the shape of one candle or the relationship between a small group of consecutive candles.
Each candle records four prices:
Open
High
Low
Close
The body shows the distance between the open and close. The wicks show how far price moved above or below the body.
A hammer, for example, records a decline followed by a recovery before the candle closes. A bullish engulfing formation uses two candles, with the second bullish body covering the body of the previous bearish candle.
The shape alone is not enough. A hammer near established support tells a clearer story than the same hammer in the middle of an uneven range. One shows lower prices being rejected at a level traders already recognise. The other may be little more than normal intraday movement.
Candlestick formations are usually grouped into single-candle, two-candle and three-candle patterns. Explore more on types of candlestick patterns; these groups are covered in more detail, along with guides to bullish candlestick patterns and bearish candlestick patterns.
A chart pattern forms when repeated price swings create a recognisable structure.
Traders may see:
Several tests of the same resistance level
A series of rising or falling lows
Price contracting between two trendlines
A neckline connecting pullback lows
A narrow channel following a strong move
An ascending triangle forms when price repeatedly reaches a similar level of resistance while the lows rise. A double top forms when price tests a previous high again but fails to continue higher. A flag appears when price pauses inside a tight channel after a strong directional move.
Some formations suggest continuation or reversal, while others remain neutral until price breaks a boundary. A symmetrical triangle, for example, does not reveal the final direction while price is still trapped inside it.
Candlestick patterns use one or a few candles. A hammer uses one. An engulfing formation uses two. A morning star usually uses three.
Chart patterns need enough movement to create several visible swings. A triangle needs repeated reactions along its boundaries. A head-and-shoulders formation needs a left shoulder, head, right shoulder and neckline.
There is no fixed candle minimum for every chart pattern. What counts is whether the swings and boundaries are clear enough to identify without forcing the shape.
Scale should not be confused with timeframe.
A two-candle engulfing pattern can cover ten minutes on a five-minute chart or two weeks on a weekly chart. A triangle can form during one trading session on a one-minute chart or take several months on a daily chart.
Candlestick patterns are therefore not automatically short-term, and chart patterns are not automatically long-term.
Candlestick patterns examine what happened inside a small number of periods. Their meaning comes from:
Where the candle opened
Where it closed
How large the body was
How long the wicks were
How one candle compared with the next
A long lower wick shows that price traded lower and then recovered before the close. A doji shows that the open and close finished near each other. An engulfing candle shows a sharp change from the previous period’s direction.
Chart patterns examine repeated behaviour around levels. Their meaning comes from:
Swing highs and swing lows
Trendline direction
Repeated failures at a boundary
Compression, expansion or a break from a range
One candle can show a strong rejection. It cannot, by itself, create a triangle, double top or head-and-shoulders structure.
Candlestick and chart patterns are confirmed in different ways. A bullish candlestick formation may receive confirmation when:
The next candle closes higher.
Price breaks above the formation’s high
Buyers maintain control after the initial reaction.
A bearish formation may need a break below its low or continued selling during the following candle.
Chart patterns require price to resolve the wider structure.
A double top remains incomplete until price breaks its neckline. A triangle is still a consolidation while price trades inside its boundaries. A flag needs a break from the corrective channel before continuation is confirmed.
The invalidation level also belongs to the structure being traded.
A candlestick idea may fail when price breaks through the opposite end of the formation. A chart-pattern idea may fail when price breaks out, reverses and closes back through the boundary that was supposed to hold.
Consider an ascending triangle on a four-hour chart. Price has reached resistance near 1.1050 three times. Each retreat stops higher than the previous one, creating a rising support line. More than 20 candles now sit inside the structure.
The chart already gives four useful pieces of information:
Resistance is holding near 1.1050.
Buyers are stepping in at progressively higher prices.
The market is becoming compressed.
The next clean break could resolve the range.
Price then pulls back towards the rising trendline. Sellers push it lower early in the four-hour period, but the decline does not hold. The candle closes near its high, leaving a long lower wick.
The next candle opens slightly lower, turns higher and closes above the body of the previous bearish candle. A bullish engulfing formation has appeared near triangle support.
That candle shows buyers reacting where the broader structure suggested they might. It does not confirm a breakout above 1.1050.
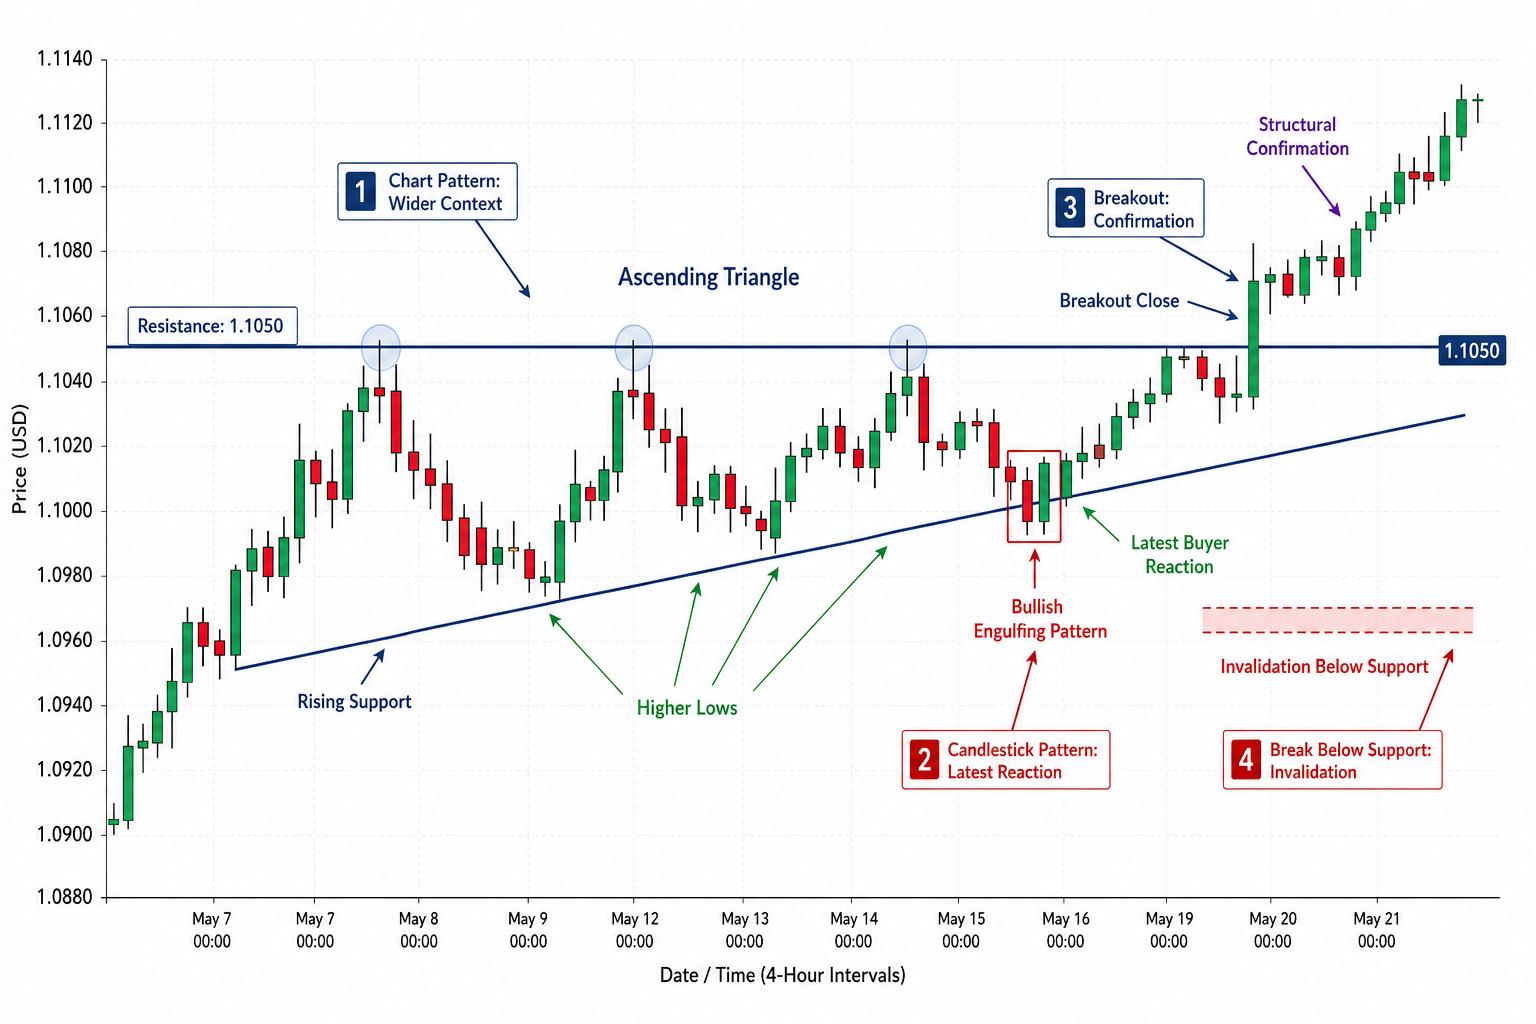
Price closes clearly above 1.1050 and remains outside the triangle.
The bullish candle near support now fits into a larger sequence:
Buyers defended the rising trendline.
Price returned to resistance.
The market closed above the upper boundary.
The candlestick reaction helped identify renewed demand. The breakout confirmed that demand was strong enough to resolve the chart pattern.
Price rises after the engulfing candle but stalls below 1.1050.
The candle worked as a local bullish reaction, yet the triangle remains unconfirmed.
Buyers defended support but still failed to clear resistance.
This is why a bullish candle inside a chart pattern should not be treated as proof that the wider breakout will occur.
Price fails to follow through and closes below the triangle support.
The bullish engulfing formation has failed. More importantly, the series of rising lows has been broken.
The lower boundary now carries more weight than the earlier candle. The structure that supported the bullish view is weakening or invalidated.
This hierarchy keeps the analysis clear:
The chart pattern provides the context.
The candlestick pattern shows the latest reaction.
The breakout or invalidation level decides whether the broader idea is confirmed or failing.
Mark the trend, range, support and resistance before looking for candlestick names.
Ask where price is trading and which levels have produced repeated reactions.
A valid chart pattern should have visible swing points that support its trendlines, neckline, or range edges.
Do not reshape the lines repeatedly to make the pattern fit.
A hammer, doji, or engulfing formation is more useful near support, resistance, a neckline or a breakout boundary than in the middle of the structure.
Read what happened during the period. Did price reject the level? Did the candle close strongly? Did the next candle follow through?
A candle near support may strengthen the bullish case, but resistance still needs to be broken. A bearish candle near a neckline may show pressure, but the neckline must still give way.
The close beyond the structural boundary is usually more important than the candlestick name.
Decide in advance which price move would weaken the idea.
That may be:
A close below the pattern support
A return inside the range after a breakout
A move through the opposite end of the candlestick formation
A failed retest of the breakout level
Without an invalidation point, the pattern becomes an opinion that can be defended indefinitely.
Hammers, dojis and engulfing candles appear often. Many form in areas where they have little technical importance.
Two similar highs do not automatically create a completed double top. A narrowing move does not always become a tradeable triangle.
Wait until the structure has clear boundaries and a defined confirmation level.
A candle can change shape dramatically before the period ends. A long lower wick may disappear if sellers return before the close.
A bullish candle near support may look encouraging, but a higher-timeframe downtrend or major resistance overhead may limit the move.
The latest candle should be read inside the full chart, not in isolation.
A chart pattern, a candlestick reaction, and a breakout can all point in the same direction and still fail.
False breakouts, sudden volatility and changing market conditions remain possible.
Both appear on price charts, but they describe different formations. Candlestick patterns use one or a few candles. Chart patterns form across many candles and several price swings.
Yes. A candlestick chart is the display format. Triangles, flags, double tops and other chart patterns can form across the candles shown on it.
Neither category is always more reliable. Results depend on the pattern’s location, clarity, timeframe, confirmation and the surrounding market conditions.
Yes. A hammer, doji or engulfing formation can appear at the support, resistance or breakout boundary of a larger chart pattern.
Usually not by itself. A candlestick formation can show a reaction inside the structure, but the chart pattern still needs a breakout, breakdown or other structural confirmation.
Chart patterns and candlestick patterns work at different scales. A chart pattern develops through repeated swings and defines the wider boundaries. A candlestick formation captures what happened during the most recent one or a few periods.
Read the structure first. Then study the candles at the level that counts. The final judgement comes from what price does at the breakout or invalidation point, not from the pattern name alone.