Published on: 2025-05-27
Updated on: 2026-04-03
Candlestick patterns help traders read short-term market sentiment and possible turning points.
Among them, bullish candlestick patterns can help identify potential reversals or continuation setups when they appear in the right context. Whether you are new to trading or refining an existing strategy, understanding these formations can help you time entries more carefully.
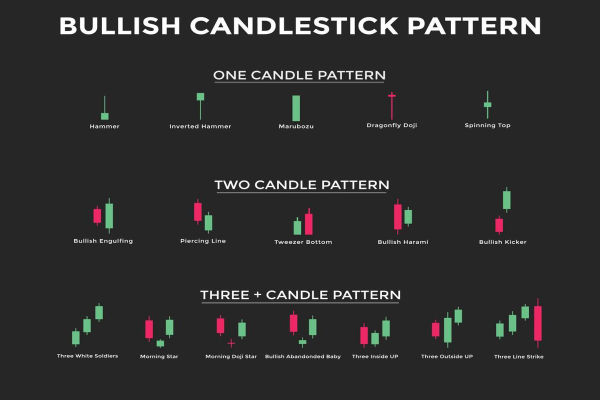
In this guide, we cover 10 bullish candlestick patterns, how to identify them, and how traders often confirm them with trend, support and resistance, and volume.”

Bullish candlestick patterns are price formations that suggest buying pressure may be increasing. They often appear near the end of a downtrend or during a pause in price action, where they can signal either a possible reversal or a continuation of an existing upward move.
These patterns are derived from Japanese candlestick charting techniques and represent the battle between buyers and sellers. Bullish patterns indicate buyers are gaining control, and prices may soon rise.
Why Bullish Candlestick Patterns Matter?
Understanding bullish candlestick patterns is vital for several reasons:
Early entry: Helps traders identify optimal buying points.
Trend reversal confirmation: Validates the end of a downtrend.
Risk management: Allows tight stop-loss placement.
Market psychology: Reflects the behaviour of institutional and retail traders.
No candlestick pattern is reliable on its own. These setups are usually more useful when they align with support and resistance, volume, trend direction, or moving averages, and when the trade has a clear risk plan.

Structure: A small red (bearish) candle followed by a large green (bullish) candle that completely engulfs the previous one.
Meaning: Signals a strong shift in momentum from sellers to buyers.
Ideal Location: At the end of a downtrend or near support levels.
Trading Tip:
Wait for confirmation on the next candle.
Use the low of the engulfing candle as a stop-loss.
Structure: A small body near the top of the candle with a long lower shadow (at least 2x the body length).
Meaning: Sellers pushed prices lower, but buyers regained control before the close.
Ideal Location: After a prolonged downtrend.
Trading Tip:
Confirm with volume or a bullish close afterwards.
Avoid sideways markets.
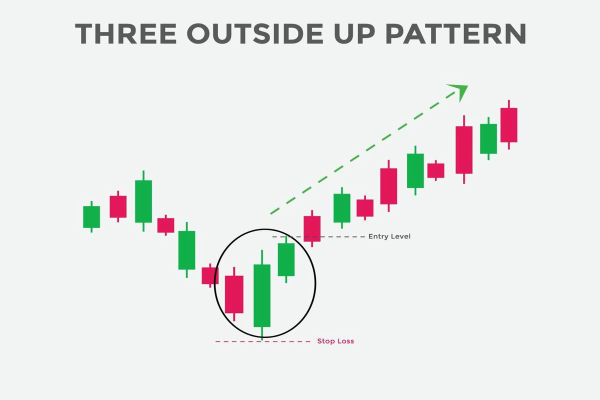
A three-candle pattern structure:
Large bearish candle
Small-bodied candle (can be bullish or bearish)
A large bullish candle that closes into the body of the first
Meaning: A reversal signal showing exhaustion from sellers and return of buyers.
Ideal Location: Bottom of a downtrend.
Trading Tip:
Wait for a break above the bullish candle for confirmation.
Best used on higher timeframes (4H, Daily).
A two-candle pattern structure:
Long bearish candle
Bullish candle that opens lower but closes above the midpoint of the previous candle
Meaning: Indicates buyers are absorbing selling pressure
Ideal Location: Near established support or after a strong sell-off into support.
Trading Tip:
Combine with rsi divergence for better accuracy.
It is generally considered weaker than a bullish engulfing pattern, so confirmation matters more.
Structure: Small body with a long upper wick and little or no lower wick.
Meaning: Sellers attempted to drive the price lower but failed.
Ideal Location: After a downtrend, often near support.
Trading Tip:
Requires bullish confirmation on the next candle.
Use tight stop-loss below the wick.
Structure: Three consecutive large green candles with higher highs and higher closes.
Meaning: Strong bullish reversal with increasing momentum.
Ideal Location: After a strong downtrend or correction.
Trading Tip:
High reliability but often occurs after the reversal has started.
Look for small wicks and increasing volume.
Two candles with matching or near-matching lows structure:
First is bearish, second is bullish
Meaning: Buyers stepped in at the same level where sellers previously dominated.
Ideal Location: Support zones or double-bottom formations.
Trading Tip:
Works well with RSI oversold signals.
Validate with a close above resistance.
Structure: A large bearish candle followed by a smaller bullish candle that fits within the body of the first.
Meaning: Shows a pause in selling pressure and potential reversal.
Ideal Location: At the bottom of a trend or during a pullback.
Trading Tip:
Confirm with a break of harami high.
Use with MACD or RSI for momentum validation.
Structure: A bullish candle followed by 3–4 small bearish candles and another bullish candle that closes above the first.
Meaning: A bullish continuation pattern during uptrends.
Ideal Location: During strong uptrend consolidations.
Trading Tip:
Best suited for swing traders looking to ride trends.
Indicates healthy corrections in bullish moves.
Structure: A doji with a long lower shadow and little to no upper shadow; open and close are at or near the high.
Meaning: Sellers pushed prices lower but were overwhelmed by buyers.
Ideal Location: Support levels or end of downtrends.
Trading Tip:
Wait for a bullish candle after the Doji.
It indicates a powerful signal when paired with a volume spike.
Use Confluence: Combine candlestick patterns with support and resistance, Fibonacci levels or trendlines.
Volume Confirmation: Strong patterns are usually backed by increasing volume.
Timeframe Matters: Patterns on higher timeframes (4H, Daily, Weekly) are more reliable than lower ones.
Risk Management: Always set stop-losses below pattern lows to limit the downside.
Avoid Overtrading: Wait for confirmation—don't act on every potential pattern.
1) Trading Patterns in Isolation
Relying solely on candlestick patterns without context can lead to false signals.
2) Ignoring Market Structure
Bullish patterns in a strong downtrend often fail. Respect the overall trend.
3) Entering Without Confirmation
Jumping in without a confirming candle increases the risk of premature entries.
4) Using Too Low Timeframes
The 1-minute and 5-minute patterns often provide unreliable signals due to market noise.
5) Overleveraging on Patterns
Even strong patterns can fail. Use prudent position sizing.
Bullish candlestick patterns can be useful tools for reading price action, but they work best as part of a broader trading process.
By learning how these 10 formations appear, where they tend to form, and how to confirm them, traders can make more structured decisions and manage risk more consistently.
Disclaimer: This material is for general information purposes only and is not intended as (and should not be considered to be) financial, investment or other advice on which reliance should be placed. No opinion given in the material constitutes a recommendation by EBC or the author that any particular investment, security, transaction or investment strategy is suitable for any specific person.