Published on: 2025-05-09
Among the numerous candlestick patterns that signal trend reversals, the Tweezer Top and Tweezer Bottom patterns are widely recognised for their simplicity and effectiveness.
Although these two patterns may appear similar, they represent opposite market sentiments—one signalling a potential bearish reversal and the other a bullish reversal.
This article will explore the key differences between the two candlestick patterns, how they form, what they indicate about market sentiment, and how traders can effectively use them in their trading strategies.

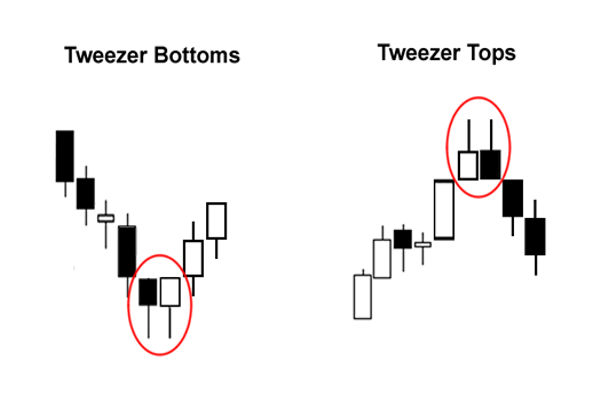
The Tweezer Top pattern is a two-candle formation that occurs after an uptrend and indicates a potential bearish reversal. It typically consists of two candles that have equal or nearly equal highs. The first candle is usually bullish (green), reflecting ongoing buying pressure, while the second is bearish (red), signalling that selling interest has emerged and may take precedence moving forward.
The pattern is named "Tweezer" because the matching highs resemble the gripping ends of a pair of tweezers. The symmetry in the highs indicates that buyers have hit a resistance level, failing to push prices any higher on the second attempt.
This stall in bullish momentum often signals buyer exhaustion, and when confirmed by additional indicators, it can present a valuable opportunity to exit long positions or enter short positions.
The Tweezer Bottom is the opposite of the Tweezer Top. It occurs after a downtrend and indicates a potential bullish reversal. This pattern consists of two candles with equal or nearly equal lows. The first candle is usually bearish (red), showing ongoing downward pressure, followed by a bullish (green) candle that signals buyers are starting to enter the market.
Like its counterpart, the matching lows of the candles suggest that the market has found a support level. Sellers attempt to drive the price lower but are rejected at the same price point where buyers enter the market, showing that bearish momentum is fading.
This makes the Tweezer Bottom an early indicator that a downtrend may be ending, offering traders a potential long entry point if further confirmation follows.
| Feature | Tweezer Top | Tweezer Bottom |
|---|---|---|
| Trend Context | Appears after an uptrend | Appears after a downtrend |
| Reversal Type | Signals a bearish reversal | Signals a bullish reversal |
| First Candle | Typically bullish (green) | Typically bearish (red) |
| Second Candle | Typically bearish (red) | Typically bullish (green) |
| Candle Highs/Lows | Both candles have matching or similar highs | Both candles have matching or similar lows |
| Market Psychology | Buyers lose strength; sellers step in | Sellers lose strength; buyers step in |
| Volume Confirmation | Higher volume on second candle adds validity | Higher volume on second candle adds validity |
| Common Use | Exit long positions or enter short trades | Exit short positions or enter long trades |
| Risk Management | Stop-loss above pattern highs | Stop-loss below pattern lows |
.png")
Trading the Tweezer Top
A Tweezer Top offers a potential signal to exit long or enter short trades, especially when confirmed by other technical factors.
Entry: Traders might enter short positions after the second candle confirms bearish momentum, especially if it breaks below the low of the first candle.
Stop-loss: A logical stop-loss can be placed just above the high of the tweezer pattern.
Take-profit: Traders can aim for previous support levels or use tools like Fibonacci retracement to estimate targets.
Trading the Tweezer Bottom
The Tweezer Bottom is used to exit short trades or initiate long positions, provided confirmation supports the reversal.
Entry: Long positions are typically considered after the second candle shows a strong bullish close, especially if it breaks above the first candle's high.
Stop-loss: A safe stop-loss could go below the lowest low of the pattern.
Take-profit: Use resistance zones or moving averages to project profit targets.
Confirmation remains key for both patterns. False signals are possible, especially in volatile or news-driven markets.
Using Indicators to Enhance Reliability
While Tweezer patterns offer valuable insight, combining them with technical indicators can improve accuracy:
Relative Strength Index (RSI): Look for divergence between price and RSI to confirm weakening momentum.
Moving Averages: A Tweezer Top near a long-term moving average could signal a strong resistance level; a Tweezer Bottom near a massive MA might indicate support.
MACD: A bearish crossover after a Tweezer Top or a bullish crossover following a Tweezer Bottom can serve as confirmation.
Volume: A Spike in volume on the second candle often strengthens the signal.
The more technical the confluence you can find, the higher the probability the pattern will lead to a meaningful reversal.
Example 1: Tweezer Top on the S&P 500
In early 2023, the S&P 500 experienced a strong rally. After several days of bullish movement, a Tweezer Top pattern formed with nearly identical highs. The second candle closed bearish on increased volume. A confirmation candle followed, leading to a short-term pullback of over 5%.
Example 2: Tweezer Bottom on EUR/USD
On the EUR/USD 4-hour chart, a downtrend culminated in a Tweezer Bottom with two candles sharing nearly identical lows. The second candle reversed with a strong bullish body confirmed by an RSI bullish divergence. The price reversed upward and gained over 100 pips in the following sessions.
New traders often misinterpret candlestick patterns by focusing solely on appearance without considering context. Here are some pitfalls to avoid:
Ignoring the Trend: These are reversal patterns, so they must appear after a clear uptrend (for the Tweezer Top) or downtrend (for the Tweezer Bottom).
Disregarding Confirmation: Acting on a Tweezer pattern without waiting for confirmation can lead to premature entries.
Failing to Consider Volume: Volume plays a crucial role in validating reversals. A confirmed pattern on low volume is less trustworthy.
Overlooking Nearby Support/Resistance: When a Tweezer Top forms just before a major breakout or significant economic news, the pattern may become invalid.
Misidentifying Similar Patterns: Confusing a Tweezer with other two-candle formations like Engulfing patterns can lead to strategic errors.
In conclusion, the Tweezer Top warns of weakening bullish momentum and possible trend reversals to the downside. The Tweezer Bottom, on the other hand, indicates that a bearish trend may be losing strength, potentially giving way to a bullish recovery.
While these patterns may seem simple, their implications are profound. Like all tools, their success lies in how and when they are used.
Disclaimer: This material is for general information purposes only and is not intended as (and should not be considered to be) financial, investment or other advice on which reliance should be placed. No opinion given in the material constitutes a recommendation by EBC or the author that any particular investment, security, transaction or investment strategy is suitable for any specific person.