Published on: 2026-07-16
The first push through support or resistance can look convincing, especially after a clean triangle, flag or double top. Then the candle closes, price slips back into the pattern, and the “breakout” disappears. It’s clear: not every breakout deserves a trade.
Chart pattern confirmation helps you avoid that trap. A pattern is only an idea. The shape tells you where to watch; the breakout shows whether buyers or sellers can hold the key level. The overall aim is to stop treating every brief move through a line as a signal.
Treat the first move through a pattern boundary as an attempt, not an automatic entry.
Use the closing candle from the same timeframe as the pattern.
A retest can help, but strong breakouts do not always return.
Volume can show whether activity increased. RSI and MACD should only be used to check whether momentum agrees.
Decide where the setup is wrong before thinking about a target.
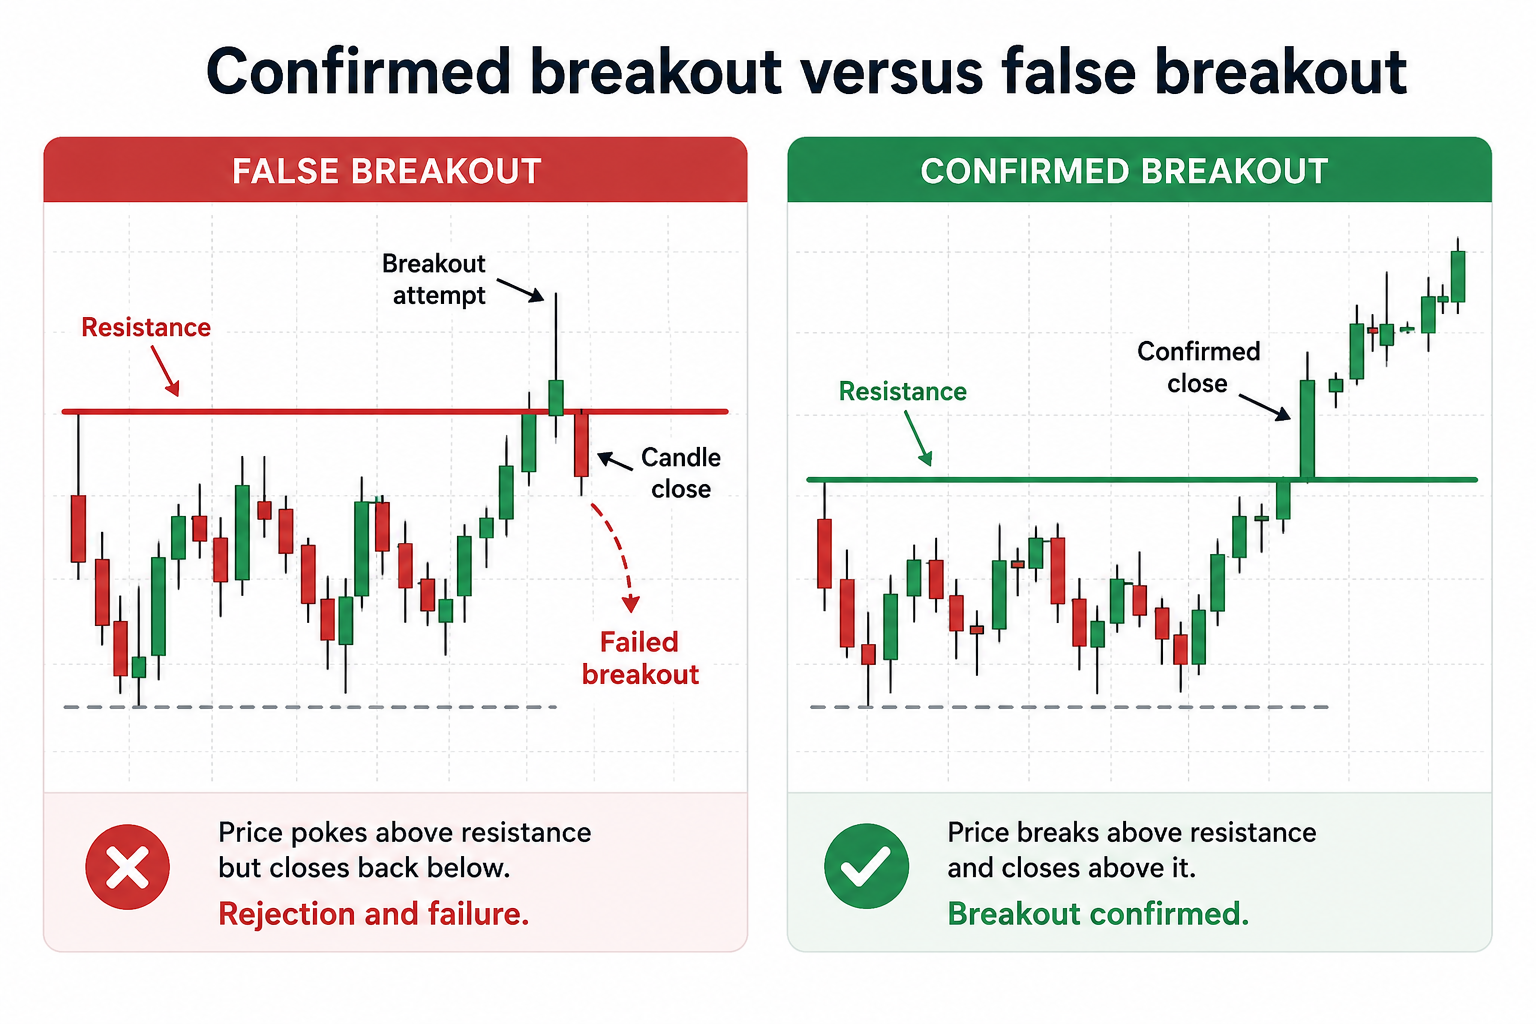
Suppose EUR/USD has spent the last few hours struggling to break above 1.1000. Every rally stalls at the same level, so traders start watching it closely. Eventually, price pushes through and prints 1.1015.
At first glance, it looks like resistance has finally given way. Some traders jump in immediately, worried they'll miss the move. Then the four-hour candle closes at 1.0985. That's the difference between trading above a level and breaking it.
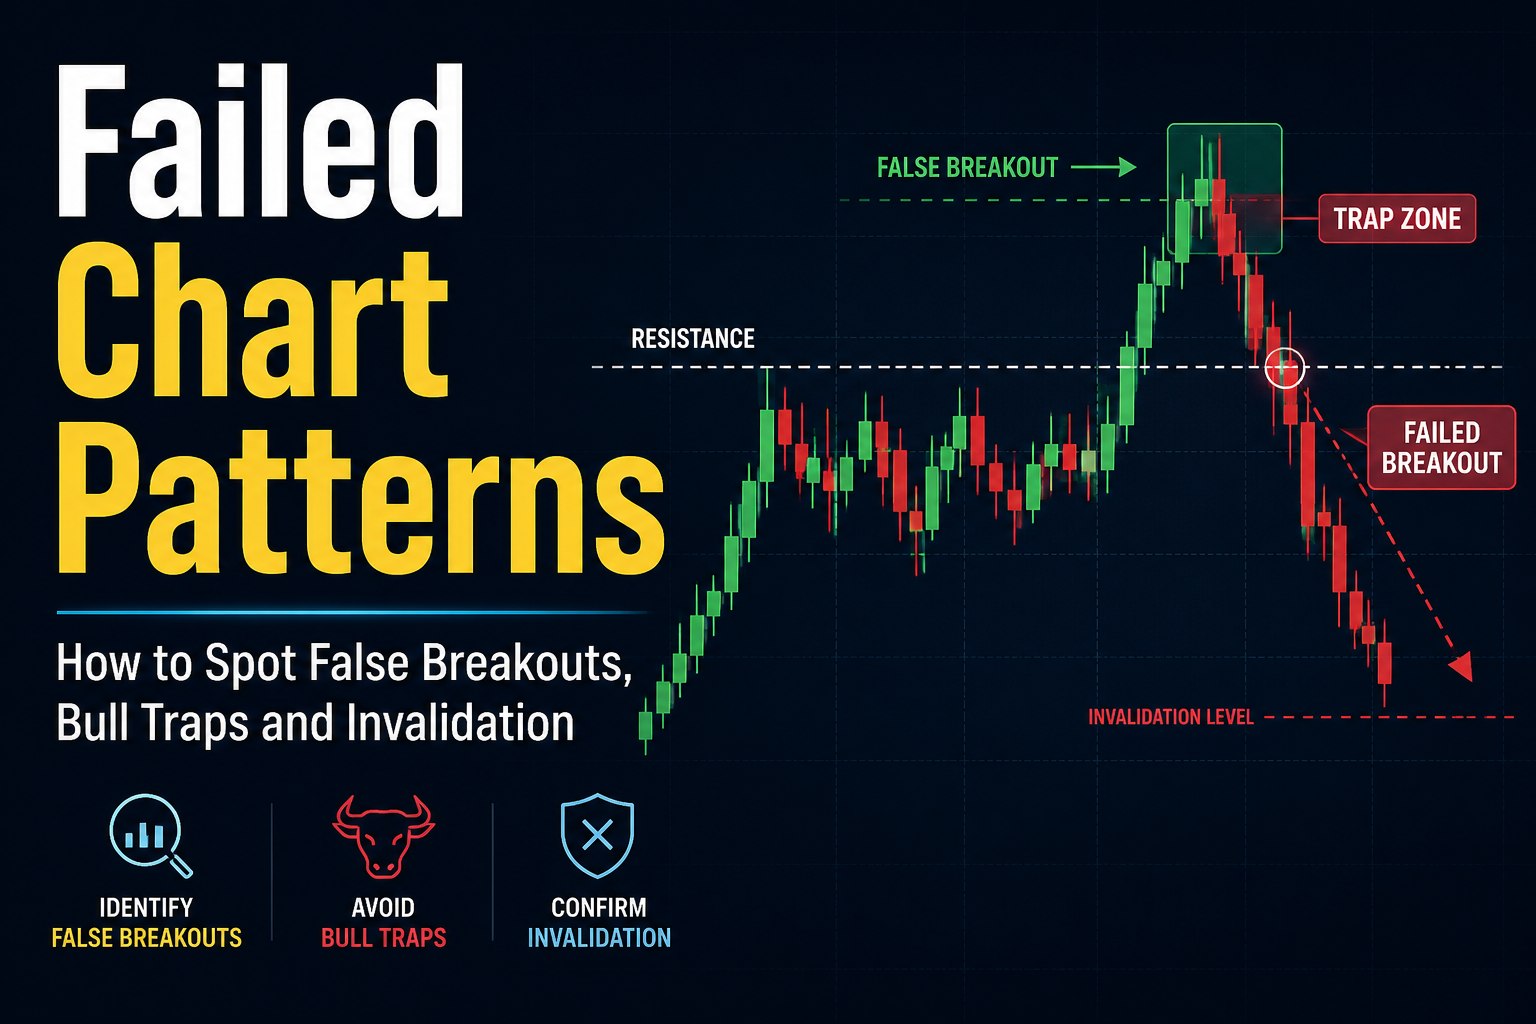
Price traded above resistance but couldn't hold. Buyers lost control before the candle closed, and the market slipped back into the old range. What looked like a breakout was really just another failed attempt.
That's why experienced traders usually wait for the candle to close before treating a breakout as valid.
Market structure, the decision level and the close are primary evidence. Retests and volume provide support. RSI and MACD are secondary. Invalidation defines the risk.
This order prevents indicator stacking. A bullish MACD crossover cannot rescue a breakout candle that closes back inside the pattern.
A bullish flag after a steady rise is easier to trust than the same shape inside a choppy range. In the first case, buyers are already making higher highs and higher lows.
Check the next timeframe up. If the setup formed on the one-hour chart, look at the four-hour chart. Is the larger trend pointing the same way? Is weekly resistance sitting just above the breakout?
Support and resistance are better treated as areas than exact numbers because buying and selling often cluster around a level.
For a double top, the key level is usually the low between the two peaks. For head and shoulders, the neckline is the focus. A triangle uses one of its sloping sides. A rectangle uses the top or bottom of the range.
Mark the level before the break. Moving it afterwards makes almost any chart look tradable.
A boundary crossing is only a breakout attempt.
The candle should close outside the pattern on the timeframe where the setup formed. A four-hour pattern needs a four-hour close. A five-minute move above resistance cannot settle that question.
The candle itself matters too. A bullish candle with a solid body and a close near its high shows buyers held most of the move. A long upper wick shows sellers pushed back before the period ended.
There is no universal pip distance or percentage. Judge the break against the market’s usual volatility and the importance of the level.
After the close, price will usually continue, return to the broken level or fall back inside the pattern.
The return is known as a retest. Imagine EUR/USD closes above 1.1000, dips to 1.1002 and then rises again. Former resistance is starting to act as support. That can offer a calmer entry and a clearer place to decide whether the move has failed.
A retest is useful, not compulsory. Fast breakouts sometimes keep going, so waiting can also mean missing the trade.
Volume shows how much activity sits behind a move. In exchange-traded markets, a breakout on rising volume means more shares or contracts changed hands. Compare the breakout candle against a recent baseline, such as the previous 20 candles, rather than deciding by eye that volume looks “high.”
Forex needs a different reading. MetaTrader usually shows tick volume, which counts price changes during each period. Exchange-traded instruments can show actual traded volume. Tick volume compares busy and quiet periods, but it is not a complete count of global currency transactions.
Volume cannot rescue a poor close. If price finishes back inside the pattern, heavy activity may simply show a hard fight at the level.
Price comes first. Indicators come later.
RSI measures the speed and size of recent price moves. For a bullish breakout, RSI moving above the middle of its range can fit improving momentum. Divergence matters when price reaches a new high or low but RSI does not.
MACD is most useful when the market is already trending. An expanding histogram can show that the move is gathering pace; a shrinking one warns that momentum is fading.
Ask one question: does momentum broadly agree with price?
Before looking at profit, identify the price action that would disprove the idea.
For a bullish breakout, that may be a close back below the old resistance area. After a retest, the retest low may also matter. For a bearish setup, a close back above the former support can indicate that sellers have lost control.
The invalidation point should come from the chart, not an arbitrary number of pips.
Failed breakouts often reveal themselves quickly:
Price moves through the level but closes inside the pattern.
The next candle erases most of the breakout.
Volume remains weak as price leaves the range.
A retest cuts straight through the broken level.
Price runs into major support or resistance immediately.
RSI or MACD weakens while price makes a fresh extreme.
Price repeatedly trades back inside the old structure.
Do not assume a failed bullish breakout is automatically a short trade. Price may simply return to the range. “No trade” is often the correct decision.
Consider this illustrative four-hour EUR/USD setup:
| Check | Reading |
|---|---|
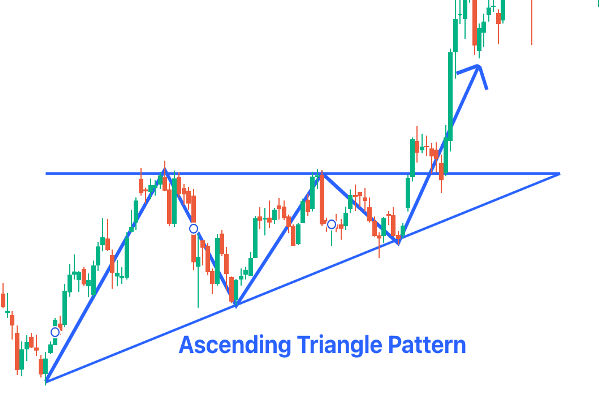
| Pattern | Ascending triangle |
| Resistance | 1.1000 |
| Breakout close | 1.1022 |
| Tick volume | 1.4 times the 20-candle average |
| Retest low and close | 1.0996 and 1.1014 |
| RSI | 57 |
| MACD | Above zero, histogram flat |
| Failure level | Four-hour close below |
The close above 1.1000, higher activity and recovery from the retest all favour the move. RSI points the same way.
MACD is less helpful because the histogram is flat. That does not cancel the setup, but it warns that momentum is not accelerating across every measure.
A four-hour close below 1.0970 would break the retest structure and put price back beneath the breakout area. The figures are illustrative, not a trading recommendation.
Before acting, ask:
Is the pattern aligned with the larger trend?
Is there room before the next major level?
Did price close outside the pattern on the correct timeframe?
Did the move continue, or did a retest hold?
Did volume rise compared with recent candles?
Do RSI and MACD broadly agree?
Where is the setup wrong?
What will you do if price returns inside the pattern?
Several unclear answers usually mean the chart is asking for patience rather than a trade.
Chart pattern confirmation is the process of checking whether a breakout has actually held, rather than reacting to the first move beyond support or resistance. A pattern only becomes tradable when price shows it can remain above the level rather than quickly slipping back inside.
Usually not. A wick only shows that price briefly traded beyond the level. The more important question is where the candle finishes. If it closes back inside the pattern, the market has rejected the breakout instead of accepting it.
No. Some strong breakouts keep moving without looking back. Others return to test the broken level before continuing. A successful retest can increase confidence, but waiting for one also means accepting that some trades will be missed.
There isn’t one. Price comes first because it shows what the market actually did. Volume can reveal whether the move attracted wider participation, while indicators such as RSI or MACD are better used to support the story than replace it.
False breakouts often reveal themselves quickly. Price breaks beyond support or resistance, attracts traders into the move, then closes back inside the old range. If the breakout level cannot hold on a retest, the original signal becomes much less convincing.
Most traders can recognise a triangle, a flag, or a head-and-shoulders pattern within seconds, but few can identify whether the market agrees. That is where mastering confirmation patterns makes you a sharper trader.
A move beyond support or resistance means very little if buyers or sellers cannot defend it by the time the candle closes. Waiting for that extra evidence will not catch every breakout, but it can filter out many of the moves that fail almost as quickly as they begin.
No confirmation method guarantees success. Markets can still reverse, news can still change the picture, and good trades can still lose money. Confirmation simply shifts the odds away from reacting to the first move and towards waiting for the market to prove its intentions.