Published on: 2026-07-16
Updated on: 2026-07-16
Failed chart patterns are most dangerous when they look convincing. Resistance breaks, momentum appears to be building, so buyers enter. Then price stalls, falls back below the breakout level and turns what looked like a strong setup into a losing trade.
What went wrong?
The pattern itself may have been perfectly drawn. The problem was that the market tested the breakout and refused to stay there. Learning to recognise that rejection matters because the move back through the level can be faster than the original breakout.
This happens in every market, including highly liquid ones. Global foreign exchange turnover averaged $9.6 trillion per day in April 2025, yet currency pairs still produce false breaks around crowded levels, during thin trading periods, and around major economic releases. Liquidity reduces some trading frictions, but it does not make chart patterns reliable.
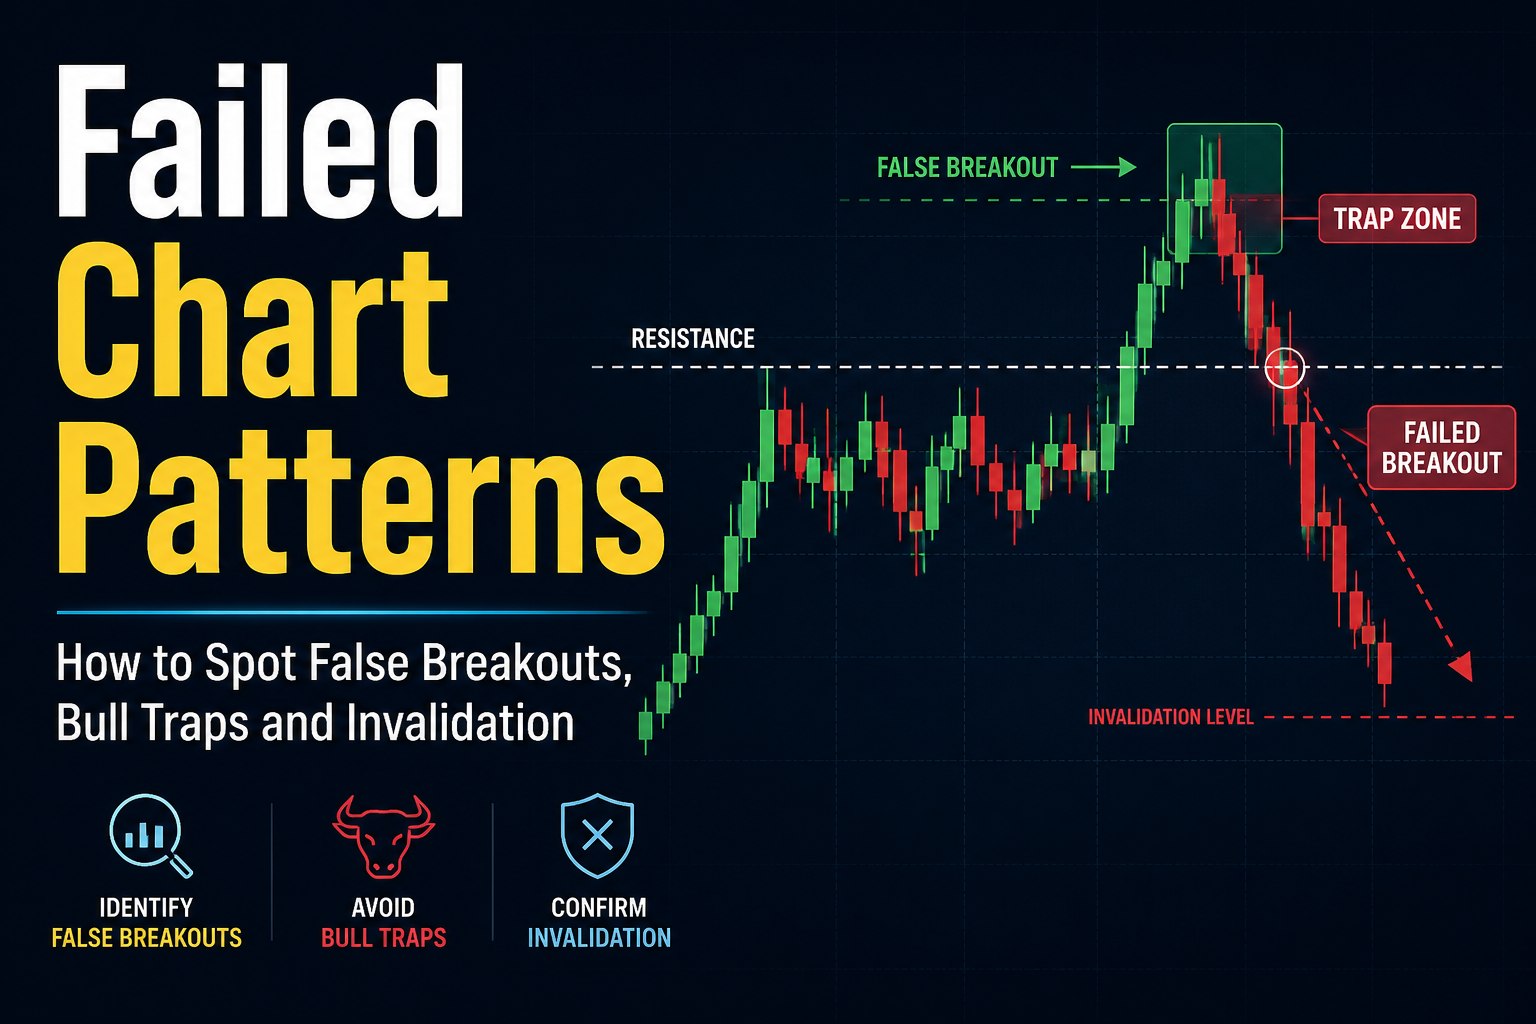
A pattern is not confirmed simply because price touches or briefly crosses its breakout level.
A false breakout occurs when price leaves the pattern but quickly returns inside it.
Bull traps catch buyers above resistance, while bear traps catch sellers below support.
Low trading activity, obvious price levels, higher-timeframe barriers and breaking news can all undermine a valid-looking setup.
Traders should respect their original invalidation level rather than moving it after the trade turns against them.
A failed breakout is not automatically a reversal trade. Price should first show that the broken level cannot be recovered.
Imagine that a share has struggled to break above $50 for several weeks.
It finally trades through $50, reaching $50.60. Buyers who have been waiting for the breakout enter. Short sellers close their positions. For a moment, everything supports a move higher.
By the end of the session, however, the share has fallen to $49.70.
The important detail is not that price briefly traded above $50. It is that buyers could not keep it there. If the next rally also stalls near $50, the breakout has failed, and the former ceiling has not become a reliable floor.
That sequence can produce several related outcomes:
| Term | What It Means |
|---|---|
| Unconfirmed pattern | Price forms a recognizable setup but never closes beyond the breakout level. |
| False breakout | Price breaks the level but quickly returns to the previous range. |
| Bull trap | Price breaks above resistance, attracts buyers, then falls back below it. |
| Bear trap | Price breaks below support, attracts sellers, then climbs back above it. |
| Pattern invalidation | Price reaches the level that proves the original trade idea is no longer valid. |
| Target failure | The breakout holds, but price fails to reach the projected target. |
These distinctions matter. A trade that misses its target has not necessarily failed. Price might still be holding above the breakout level and moving in the expected direction, only more slowly than anticipated.
A genuine failure attacks the logic behind the trade.
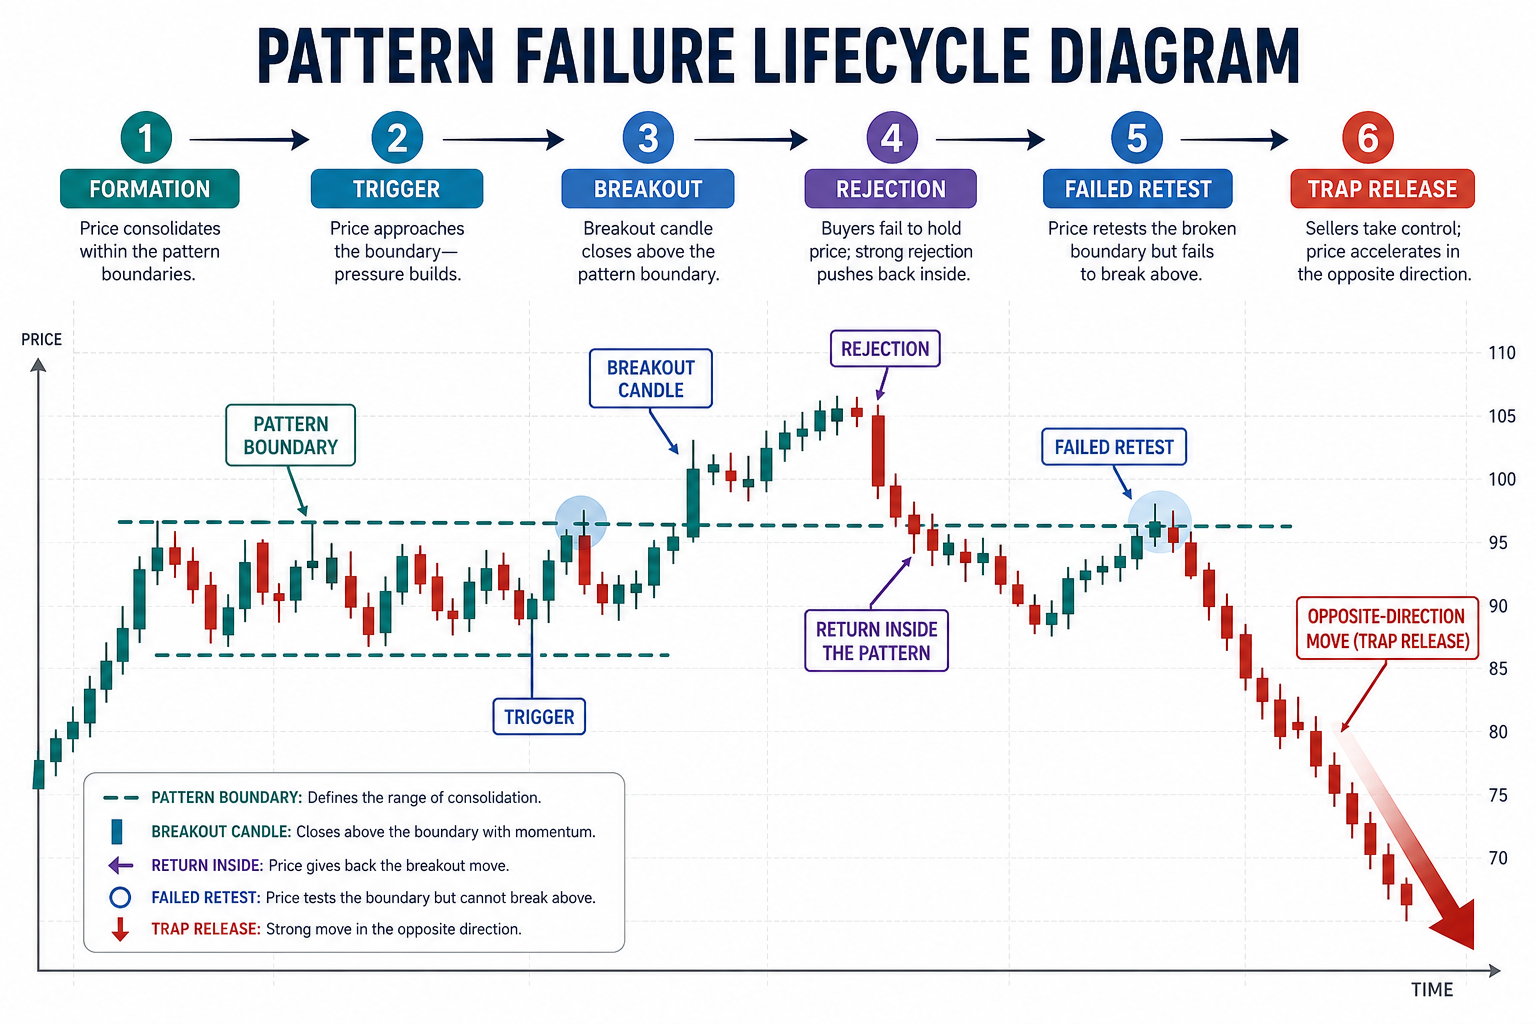
A chart usually moves through a sequence, and each stage gives traders a little more information; patterns rarely fail all at once.
More often, a failed pattern unfolds in stages. Each one answers a different question: Has the market tested the level? Has it accepted the new price? Or has it quietly decided to go back where it came from?
Price begins to create a familiar shape, such as a triangle, rectangle, double top or head-and-shoulders pattern. At this stage, the pattern is only a possibility. This is the easiest stage to become overconfident. A clean-looking pattern feels as though it's already telling you what comes next.
However, nothing has been confirmed, even if the shape looks textbook-perfect.
Eventually, price moves through levels traders are watching, such as resistance, support, trendlines, or necklines. This is where many beginners enter too early. A brief move through the level, especially one driven by a long wick, proves that the market visited a new price. It says nothing about whether it wants to stay there.
A healthier breakout begins to hold beyond the trigger level. Candles close outside the pattern, pullbacks remain on the breakout side, and momentum continues in the same direction. Former resistance may start acting as support, or former support may turn into resistance.
This is the point where the breakout begins to look more credible.
The warning signs appear when price returns inside the old pattern. Perhaps the breakout loses momentum, the next candle closes back below resistance, or a retest fails to attract fresh buyers. The market has tested the new price area and decided not to remain there.
A single wick is not always enough to confirm failure. Repeated closes back inside the structure carry more weight.
Once traders realise that the breakout has failed, their exits can add speed to the move in the opposite direction. Buyers caught in a bull trap may sell to cut losses. Short sellers caught in a bear trap may buy back their positions. Those forced exits can turn a quiet rejection into a sharp reversal.
The full sequence looks like this:
Formation → Trigger → Acceptance or Rejection → Failed Retest → Trap Release
The breakout candle is only the beginning of the story. The more revealing question comes afterwards: once the market has crossed the level, does it actually want to stay there?
Not every pullback after a breakout is a warning.
Strong breakouts often return to test the level they have just crossed. Traders call this a retest. In a bullish breakout, former resistance should begin to act as support. Price may dip toward the level, attract fresh buying and then continue higher.
A false breakout behaves differently.
| Normal Bullish Retest | Failed Bullish Breakout |
|---|---|
| Price pulls back toward former resistance | Price falls decisively below former resistance |
| Buyers defend the level | Buyers fail to regain control |
| Candle bodies remain mostly above the breakout level | Candle bodies close back inside the previous range |
| Momentum resumes after the pullback | Recovery attempts become progressively weaker |
| Price continues toward the next target | Price rotates back toward the middle of the previous range |
The difference is not a single wick. It is what price does next.
Does the market recover to that level quickly, or does every bounce struggle to reach it? That follow-through often tells traders more than the initial breakout candle.
Some breakouts are driven by a short burst of orders rather than broad buying or selling.
Price jumps through resistance, but few traders are willing to keep buying at the higher level. Once the first burst fades, there is not enough demand to hold the move.
Volume can help reveal this weakness, although it must be read in context. Exchange-traded equities and futures have centralised volume figures. CME futures markets, for example, publish daily trading volume and open interest. Spot foreign exchange is an over-the-counter market, so the volume shown on a retail platform typically reflects broker activity or price changes rather than total global trading volume.
Low volume does not guarantee failure. It simply gives traders less evidence that the wider market supports the breakout.
Round numbers, equal highs, equal lows, and previous-session extremes attract attention because they are easy to see.
They also attract orders.
Research on foreign exchange order flow found that stop-loss and take-profit instructions cluster around round numbers that are commonly treated as support and resistance. When price reaches one of these areas, it can trigger a burst of buying or selling without producing a lasting breakout.
This is often described as stop hunting, but traders should be careful with that explanation. A false breakout does not prove that a large institution deliberately manipulated the price. An obvious level naturally concentrates orders. Once those orders are triggered, price may briefly overshoot before returning to its previous range.
A five-minute triangle might look bullish, but the setup becomes less attractive when it breaks directly into daily resistance.
The lower-timeframe pattern is not necessarily wrong. It simply has limited room to develop.
Before trading a breakout, look one or two timeframes higher. Where is the next major high, low or consolidation area? Is the pattern aligned with the broader trend, or is it asking price to reverse a much larger move?
A clean pattern in a poor location is still a poor trade.
Charts reflect the information traders had before the announcement. A surprise inflation reading, interest-rate decision, earnings result or geopolitical headline can change the price investors are willing to accept within seconds.
Research using high-frequency market data has found significantly more price jumps on days with macroeconomic news than on days without major releases. US economic announcements can also cause immediate moves across global equities, commodities and volatility markets.
This is why a pattern can look valid one minute and become irrelevant the next. The chart did not “predict badly.” New information changed the market.
Holiday sessions, overnight periods and the minutes before major announcements often have fewer active buyers and sellers.
With less liquidity available, smaller orders can move price farther than usual. That makes sharp wicks and temporary breaks more common.
A breakout during the market’s busiest session usually carries more information than the same move during a quiet transition between trading regions.
A bull trap begins with optimism.
Price breaks above resistance, encouraging traders to buy. When it falls back below the level, those new buyers are trapped in losing positions. Some exit quickly. Others place stops below the range. Their selling can add momentum to the decline.
A bear trap is the mirror image. Price breaks below support, short sellers enter, and then the market reclaims the level. If sellers rush to close their positions, those buy orders can push price higher.
The strongest traps usually contain three parts:
A clear break through an obvious level.
A decisive move back inside the old range.
A failed attempt to recover the breakout direction.
That third step matters. It shows that the breakout side has been given another chance and still cannot take control.
A simple five-question check can slow down the decision. The word FALSE makes it easier to remember.
| Check | Question to Ask |
|---|---|
| F – Follow-through | Did price continue after the breakout, or did the move stall almost immediately? |
| A – Above or below the level | Are candle bodies closing beyond the breakout level, or are only the wicks crossing it? |
| L – Liquidity and volume | Is trading activity supporting the move, or did it occur during a thin trading session? |
| S – Structure | Does the breakout have room to continue on the higher-timeframe chart? |
| E – Event risk | Is an economic release, earnings report, or major announcement approaching? |
No single answer confirms failure.
A weak-volume breakout can still continue. A candle can also close back inside a pattern before recovering on the next bar. Evidence becomes more convincing when several warnings appear together.
For example, price breaks resistance during a quiet session, closes back below it, fails on the retest and then falls with stronger momentum. That is a much clearer failure than one isolated wick.
First, return to the original trade plan.
Where was the setup supposed to be proven wrong? If price has reached that level, moving the stop farther away does not improve the trade. It simply increases the amount at risk after the evidence has weakened.
Next, avoid reversing the position out of frustration.
A failed bullish breakout does not always lead to a large decline. Price may simply return to the middle of the range and move sideways. Traders looking for a reversal should wait for more than re-entry.
A stronger reversal sequence is:
Price breaks the original level.
It closes back inside the pattern.
It retests the failed breakout.
The retest cannot recover the level.
Momentum begins building in the opposite direction.
Stops on a reversal trade are often placed beyond the extreme of the false breakout. That level represents the point where the trap idea itself would be wrong. Position size should then be adjusted to the stop distance rather than choosing a fixed number of shares, contracts or lots.
The main lesson is simple: exit decisions should come from the chart, not from the desire to be right.
Some patterns are best left alone before they have the chance to fail.
Consider avoiding the setup when:
It forms in the middle of a wide range with no clear boundary nearby.
The breakout runs directly into major support or resistance on a higher timeframe.
The next realistic target is too close to justify the required stop.
Trading activity is unusually light.
A major economic release, central bank decision, or earnings report is imminent.
The pattern points against a strong trend without showing a clear shift in momentum.
The breakout is mostly a long wick that immediately loses the level.
Beginners often focus on finding more patterns. Experienced traders spend just as much time rejecting weak ones.
Pattern recognition creates possibilities. Context decides whether those possibilities are worth trading.
Price often returns to the previous range. Trapped traders may close their positions, adding momentum in the opposite direction. The market might then move toward the range midpoint, test the other side of the pattern or settle into consolidation.
The shape may have been correct, but the surrounding conditions were weak. The breakout might have lacked volume, run into a higher-timeframe barrier, occurred near a crowded level or been disrupted by new information.
It is an important warning, but not always final proof. Look at the next retest. If price cannot recover the breakout level and momentum strengthens in the opposite direction, the case for failure becomes much stronger.
No. Some false breakouts return to a range without developing into a trend. Waiting for a failed retest helps distinguish a genuine reversal setup from ordinary market noise.
No. Volume should be compared with normal activity for that market, session and timeframe. Low activity weakens the evidence behind a breakout, but price structure and follow-through remain important.
A failed pattern is a message from the market, not just a setup that did not make money. Price tested an area where buyers or sellers were expected to take control, and they could not hold it. That failure can reveal weak momentum, trapped traders and a possible move back through the previous range.
The useful question is “What did price do after the breakout?” Watch whether the level holds. Check the higher timeframe. Know when news is due. Respect the point where the trade idea stops working.
The pattern gets attention. The reaction to it tells the real story.