Published on: 2026-07-17
Updated on: 2026-07-17
A triple bottom pattern tells the same story in reverse. Sellers drive price into the same floor three times. Buyers keep absorbing the pressure. Yet the reversal only becomes credible when price breaks above the resistance created by the rebounds.
Suppose the price has reached the same ceiling twice. Both times, sellers appeared. Both times, buyers came back.
Now it is climbing there again. For a trader watching the chart, the question is immediate: Is this really a triple top pattern, or is the market about to break higher?
The answer does not sit at the third peak. It sits lower down, at the support level that has held the structure together. Until that support breaks, buyers have not lost control. They are simply stuck.
These patterns are easy to spot after the move is over. Trading them in real time is harder. The real work lies in deciding whether the market is reversing, ranging or preparing to continue in the original direction.
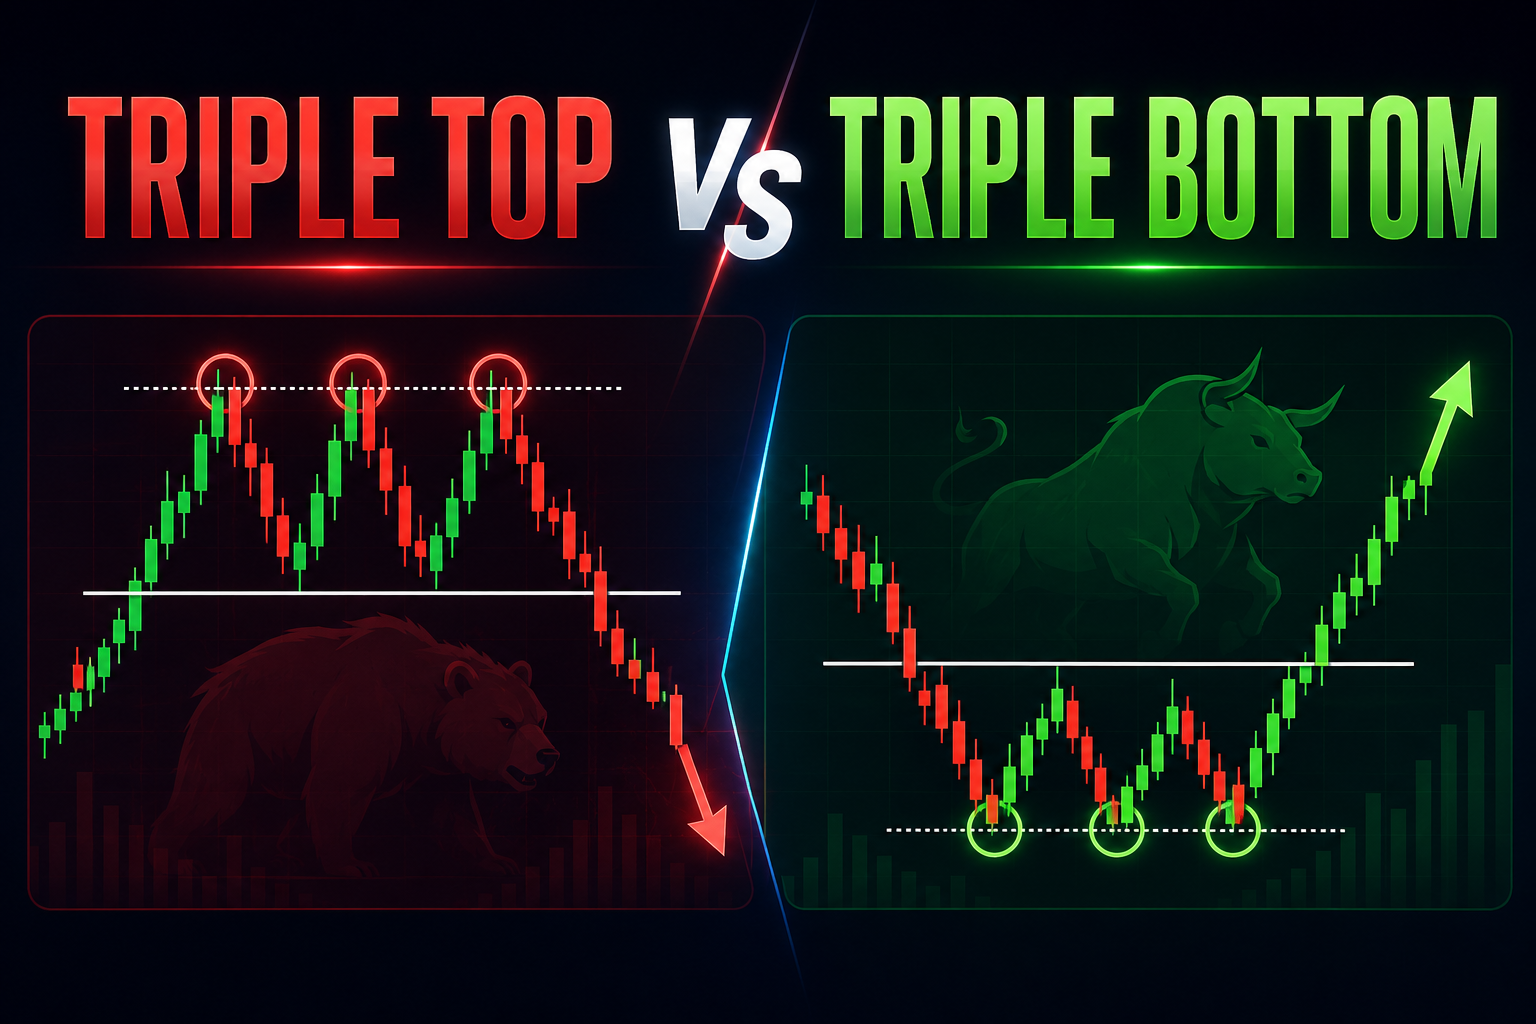
A triple top forms after an uptrend and points to a possible bearish reversal.
A triple bottom forms after a downtrend and points to a possible bullish reversal.
Three peaks or troughs create the setup. A neckline break confirms it.
The turning points need to form within the same price zone, not at a single price.
A triple pattern differs from a double pattern only if the neckline remains intact before the third test.
Candle closes, momentum, participation and retests help filter false breaks.
Position size should come from the stop distance, not from confidence in the chart.
Start with the simplest test: Was there a clear trend before the pattern appeared? A triple top needs an uptrend. A triple bottom needs a downtrend. Without that prior move, the structure is more likely to be a range than a reversal.
Next, count the tests. A triple top contains three failed attempts to break through resistance. A triple bottom contains three failed attempts to break through support. The reactions between those tests form the neckline.
Then ask the decisive question: has price closed beyond that neckline? If not, the pattern is unfinished. That point separates a useful chart pattern from three convenient-looking turning points.
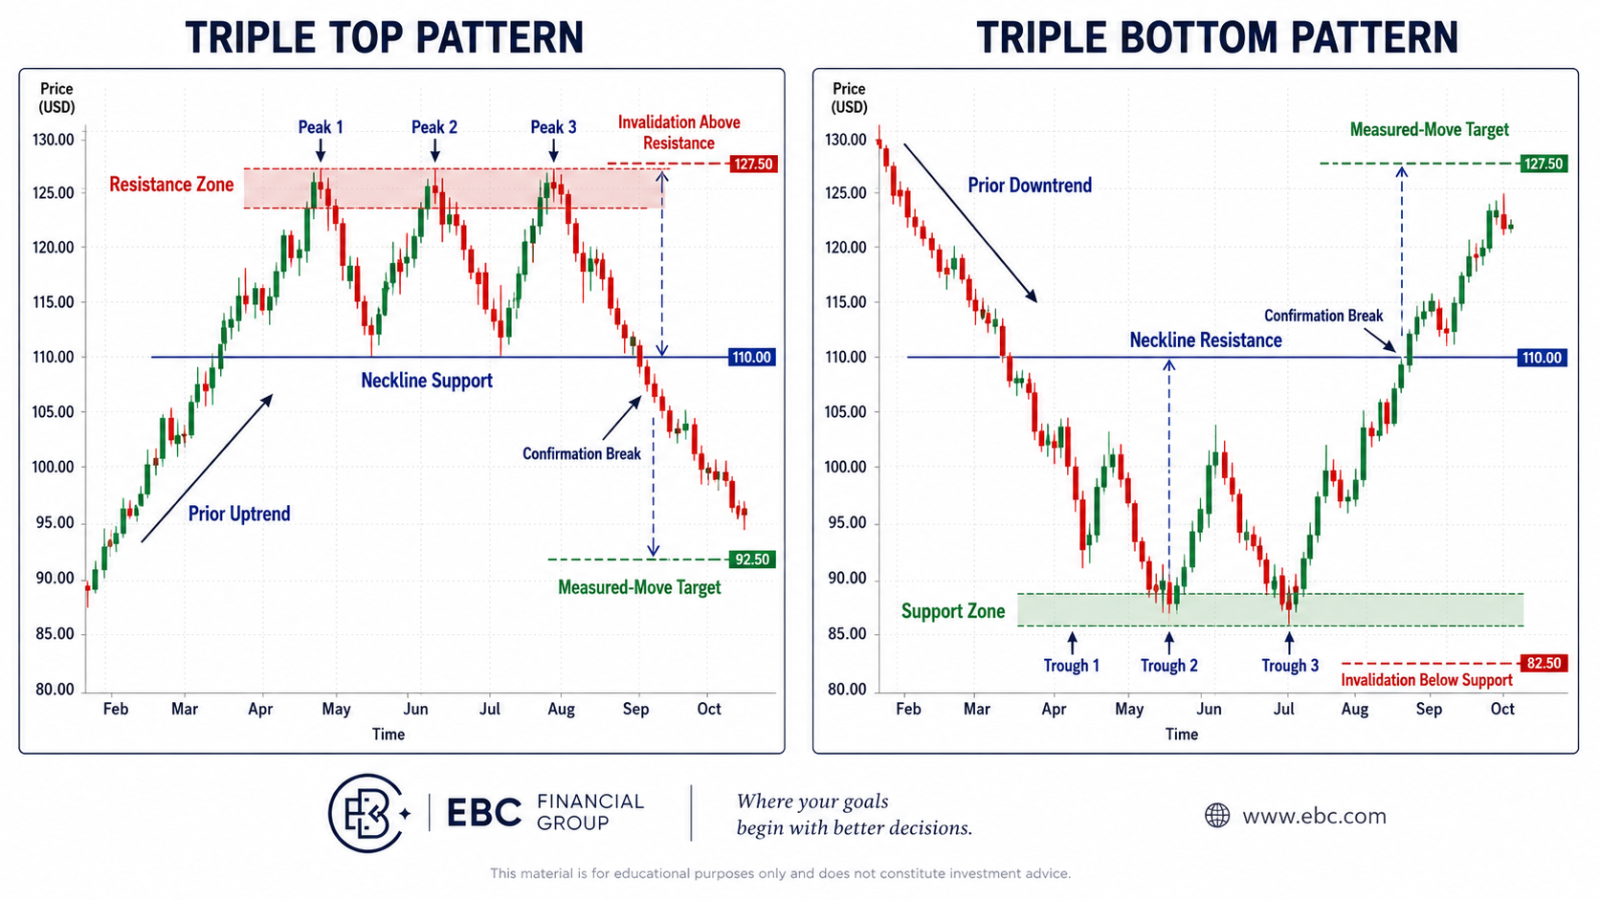
A triple top is a bearish reversal structure that forms after price has been rising.
Imagine a share climbing from $80 to $100. At $100, sellers step in and push it back to $94. Buyers return and push it back to $100, but the rally stalls. Price falls to $95, then recovers on a third attempt to reach $99.80.
The chart now has three peaks near the same resistance area. It looks bearish. It is not confirmed. The two pullbacks around $94 and $95 create neckline support. If price stays above that zone, buyers still have a base from which to launch another rally. A close below it changes the structure.
The sequence is straightforward:
Price reaches resistance and forms the first peak.
Sellers push it lower, creating the first reaction low.
Buyers return, but the second rally fails near the same resistance zone.
Another decline helps define neckline support.
A third advance stalls again.
Price closes below the neckline, confirming the bearish reversal.
The third rejection attracts attention. The breakdown carries the information. Once price loses the neckline, buyers who entered during the formation face pressure. Some exit. Short sellers enter. A slow range can turn into a faster decline.
Traders place stops around obvious levels. Breakout orders gather above resistance. Sell orders cluster near the peaks. The chart becomes a map of expectations.
Sellers defend a level.
Buyers discover that the earlier barrier still exists.
Both sides know where the fight is taking place.
Repeated tests do not always increase resistance. Each attempt also consumes some of the sell orders defending it. That is why the third test is not automatically bearish. Price could still break higher.
The neckline reveals which side has lost control first.
A triple bottom forms after a decline and signals that sellers are struggling to push price lower. Suppose a currency pair falls from 1.1200 to 1.0800.
Buyers step in at 1.0800 and lift it to 1.0950. Sellers return, but the next decline stops at 1.0810. Price rebounds, fails near 1.0960, then falls for a third time and holds around 1.0790.
Three troughs now sit in the same support zone. Is the downtrend over? Not yet.
The reaction highs around 1.0950 form neckline resistance. Buyers confirm control only when price closes above that area.
The pattern develops in six stages:
Price reaches support and forms the first trough.
Buyers produce a rebound.
Sellers retest support but fail to extend the decline.
A second rebound defines neckline resistance.
A third decline is rejected near support.
Price closes above the neckline and confirms the bullish reversal.
The repeated lows tell traders that selling pressure is no longer producing progress. The breakout shows that buyers can now do more than defend. They can advance.
A strong breakout forces late sellers to reconsider. Some cover short positions, adding more buying pressure to the move.
Low attracts bargain hunters and short-term buyers.
Sellers that the support zone remains active.
Market has become crowded with expectations. Some sellers are still pressing the downtrend. Others are taking profits. Buyers are waiting for proof that the decline has ended.
| Feature | Triple Top | Triple Bottom |
|---|---|---|
| Prior trend | Uptrend | Downtrend |
| Repeated test | Resistance | Support |
| Neckline | Support between the peaks | Resistance between the troughs |
| Confirmation | Close below the neckline | Close above the neckline |
| Expected outcome | Bearish reversal | Bullish reversal |
| Typical trade bias | Sell or reduce long exposure | Buy or reduce short exposure |
| Invalidation | Break above the resistance zone | Break below the support zone |
| Measured target | Projected below the neckline | Projected above the neckline |
The two structures mirror each other, but markets do not always behave symmetrically. Downside breaks often accelerate through liquidation. Traders who bought the range rush to exit. Leveraged positions amplify the move.
Upside breaks gain speed through short covering. Sellers who expected another failure must buy back their positions. The chart pattern is only the starting point. Positioning and liquidity shape what follows.
Beginners often ask whether a double top simply becomes a triple top when a third peak appears. Sometimes it does. Sometimes it does not. The neckline decides.
| Feature | Double Pattern | Triple Pattern |
|---|---|---|
| Number of tests | Two | Three |
| Formation time | Usually shorter | Usually longer |
| Frequency | More common | Less common |
| Confirmation | Neckline break after the second test | Neckline break after the third test |
| Main challenge | Entering before confirmation | Mistaking a trading range for a reversal |
| Market message | Two failed attempts to continue the trend | Three failed attempts to continue the trend |
Consider a double top with peaks at $50 and neckline support at $46.
If price falls below $46 after the second peak, the double top is confirmed. A later rally toward $50 does not rewrite the earlier signal.
But if price holds above $46 and returns to $50 for a third attempt, the structure has evolved into a possible triple top.
The same logic applies to bottoms. Do not classify patterns by counting turning points after the outcome. Follow the order in which the market produced them.
Yes, if the neckline remains unbroken. A double top can develop into a triple top when price returns for a third test of the same resistance zone before breaking neckline support. The same applies to a double bottom at support.
Once the neckline breaks after the second test, the double pattern is already confirmed. A later move does not turn it into a triple pattern.
In practice:
Two tests, neckline intact: possible double pattern.
Third test, neckline intact: possible triple pattern.
Neckline break after two tests: confirmed double pattern.
Neckline break after three tests: confirmed triple pattern.
A third test supplies more evidence that the level matters. It also gives the market another chance to break it. That tension is easy to miss.
A trader sees three rejections and assumes the barrier has become stronger. Yet every test also works through available orders. Resistance can weaken. Support can weaken too.
Reliability comes from the full setup:
the prior trend,
the spacing between tests,
the quality of the neckline,
the breakout close,
the level of participation,
the wider market context.
The number three is not a guarantee.
The neckline sits between the three peaks or troughs. For a triple top, connect the two reaction lows. For a triple bottom, connect the two reaction highs.
Those points rarely match perfectly. Treat them as a zone rather than a single price. Confirmation comes in degrees:
| Price Action | Interpretation |
|---|---|
| Wick beyond the neckline | Weak confirmation |
| Candle closes beyond the neckline | Standard confirmation |
| Strong close with expanding range | Stronger confirmation |
| Breakout followed by a successful retest | Higher-quality confirmation |
Suppose a triple top has neckline support near $94.
Price trades down to $93.50 during the session but closes at $94.40. That is not a clean breakdown. Sellers crossed the level but failed to hold below it.
Now suppose price closes at $93.20 on a wide-range candle and remains below $94 the next day. The evidence is stronger.
The close matters because markets often move through obvious levels before reversing. Stops are triggered. Breakout traders enter. Liquidity is collected. Then price snaps back.
After a triple-top breakdown, price might return to the neckline from below. Sellers who missed the first move may enter there. Buyers trapped in the original range may use the rebound to exit.
A triple bottom works in reverse. Former resistance can become support. That retest creates a cleaner decision point. If the level holds, the new structure remains intact. If price closes back inside the pattern, confidence falls quickly.
No retest is guaranteed. Strong moves sometimes leave without offering a second chance.
| Factor | Stronger Pattern | Weaker Pattern |
|---|---|---|
| Prior trend | Clear directional trend | Sideways market |
| Peaks or troughs | Form within the same price zone | Large variation between turning points |
| Separation | Distinct swings between tests | Crowded, minor fluctuations |
| Neckline | Clearly defined | Difficult to identify |
| Momentum | Trend strength is fading | Momentum remains strong |
| Breakout | Strong close beyond the neckline | Wick-only penetration |
| Participation | Increasing volume or trading activity | Thin participation |
| Higher timeframe | Supports the reversal | Conflicts with the setup |
| Event risk | No major announcement nearby | High-impact news approaching |
They do not need to match exactly. A resistance zone between $99.50 and $100.20 could still form a valid triple top. What matters is whether traders repeatedly react to the same area.
Volatility provides the proper context. A $1 difference means little in an asset that moves $5 a day. It means far more in one that moves only $0.50. Recent average true range offers a better guide than a universal percentage rule.
Each test should look like a separate contest between buyers and sellers. Three peaks formed within five small candles often amount to noise. Three peaks separated by clear pullbacks carry more weight because the market had time to attract new orders and fresh participants.
Very long gaps create a different problem. The economic backdrop, volatility regime or trend may have changed so much that the turning points no longer belong to one coherent structure.
Every breakout trader eventually meets the same unpleasant sight: price crosses the level, triggers the trade, then turns straight back.
False breaks are not rare exceptions. They are part of the market.
Wick-Only Break: Price moves through the neckline but closes back inside the formation. The level was tested, not lost.
Immediate Neckline Reclaim: Price closes beyond the neckline, then reverses within the next candle or two. This is more serious. Breakout traders are now trapped, and their exits can fuel a move in the opposite direction.
News-Driven Break: An inflation report, earnings release, or central bank decision sends price through the neckline. Spreads widen. Orders slip. The first move often reflects shock rather than stable direction. A trader entering during that burst faces a different market from the one that created the pattern.
Low-Liquidity Break: Quiet sessions exaggerate small order flows. A neckline break during thin trading deserves less confidence than one formed during an active session with broad participation.
Break Without Momentum: Price crosses the neckline, but the candle range remains narrow. Volume stays weak. Momentum does not improve. The market has crossed the line, but few traders appear willing to follow.
Failed Retest: Price returns to the neckline and moves straight back inside the formation. That is the market rejecting the breakout. It is also a warning that the original trend or range could resume.
For a triple top, a decisive move above the three-peak resistance zone invalidates the bearish structure. For a triple bottom, a decisive move below the three-trough support zone invalidates the bullish structure. A neckline reclaim also matters.
Suppose a triple top breaks below support, then quickly closes back above it. The trade is no longer behaving as expected. If price then clears the resistance zone, the failed reversal could turn into a continuation move. Why?
Short sellers are trapped. Their stops sit above resistance. Buyers see the failed breakdown and enter. The market now has fuel on both sides.
Failed triple bottoms work the same way in reverse. A failed pattern does not create an automatic trade in the opposite direction. It does demand a fresh reading of the market.
There are three common entry methods.
Breakout Entry: Enter after price closes beyond the neckline. This captures more of the move but also carries greater exposure to false breaks.
Retest Entry: Wait for price to return to the neckline. In a triple top, former support should hold as resistance. In a triple bottom, former resistance should hold as support. The entry is often cleaner. The stop is often tighter. The cost is obvious: the retest might never come.
Anticipatory Entry: Enter near the third peak or trough before confirmation. The reward-to-risk ratio looks attractive because the stop sits close to the pattern extreme. The danger is equally clear. The reversal has not started. Price could remain inside the range or break in the original trend direction.
For beginners, neckline confirmation provides the more disciplined route.
The traditional price objective is determined by the height of the pattern.
For a triple top:
Pattern height = resistance zone minus neckline
Downside projection = neckline minus pattern height
For a triple bottom:
Pattern height = neckline minus support zone
Upside projection = neckline plus pattern height
Suppose a triple top forms near $100 with neckline support at $94. The pattern height is $6. A break below $94 creates a measured projection near $88.
That does not make $88 inevitable. Price could stop at $91, reverse at $90 or accelerate below the projection. The target is a planning tool, not a promise.
A structural stop sits beyond the highest peak in a triple top or below the lowest trough in a triple bottom.
A retest stop sits beyond the swing formed after price returns to the neckline. A volatility-adjusted stop adds room based on ATR or recent trading range.
Each choice changes the position size. A wider stop requires a smaller trade.
| Item | Example |
|---|---|
| Account equity | $10,000 |
| Maximum account risk | 1% |
| Maximum monetary loss | $100 |
| Entry price | 1.2700 |
| Stop-loss | 1.2800 |
| Stop distance | 100 pips |
| Target price | 1.2450 |
| Reward-to-risk ratio | 2.5:1 |
The position must be small enough that a 100-pip loss costs no more than $100. That calculation comes before the trade.
A clear pattern does not justify greater risk. A beautiful chart still fails. Stops also do not guarantee execution at the exact chosen price. During fast or illiquid conditions, slippage can produce a worse fill.
Volume adds useful context, but the data differs across markets.
Listed shares and futures trade on centralised venues with observable exchange volume. Spot forex is decentralised. Forex traders often rely on tick activity, currency futures volume, candle range and session participation instead.
Momentum indicators can help answer a simple question: is the market losing force?
A triple top supported by bearish RSI divergence carries more evidence than one formed while momentum is still accelerating. A triple bottom with improving MACD momentum tells a stronger story than one formed during relentless selling.
Indicators should support the chart. They should not overrule it. The higher timeframe matters too.
A triple top forming at weekly resistance deserves more attention than one appearing in the middle of an ordinary intraday range. A triple bottom near a long-term support zone carries more weight than three small bounces against a powerful downtrend.
A triple top is a bearish reversal setup that forms after an uptrend. It becomes confirmed only when price closes below the neckline connecting the reaction lows.
Yes, after confirmation. Three lows create the setup, but buyers must break and close above neckline resistance before the bullish reversal is established.
No. They should sit within the same recognisable support or resistance zone. Exact equality is uncommon because volatility and liquidity change from one test to the next.
Yes, when the neckline remains intact and price returns for a third test of resistance. If the neckline already broke after the second peak, the double top was confirmed earlier.
Not automatically. The third test adds information but also places more pressure on the level. Breakout quality, prior trend, volatility and market context matter more than the number of peaks or troughs.
A quick move back inside the formation warns of a false break. A sustained reclaim weakens the setup and, if price also breaks the pattern extreme, could support continuation in the original trend direction.
No, but stronger participation adds confidence. Exchange volume works well in centralised markets, while spot forex traders rely more on tick activity, futures volume, range expansion and session behaviour.
Measure the distance between the neckline and the peak or trough zone. Project that distance from the neckline in the direction of the breakout.
Three peaks draw the eye. Three troughs do the same. Neither completes the trade.
A triple top becomes meaningful when buyers lose neckline support. A triple bottom becomes meaningful when buyers take neckline resistance. Until then, the market is still negotiating.
The best setups combine a clear prior trend, distinct tests, a visible neckline and a convincing break. The best trades add something else: a known exit point and a position size small enough to survive being wrong.