Published on: 2025-07-16
Updated on: 2026-03-17
Candlestick analysis remains a powerful tool for traders spanning global markets, from forex to equities. Among its myriad formations, the Harami candlestick pattern, which means "pregnant" in Japanese, is a subtle indicator suggesting potential reversals.
Though less dramatic than engulfing patterns, its subtler message can help traders anticipate indecision or trend reversals.
In this guide, we'll explore what Harami candlesticks reveal, their bullish and bearish variations, how to trade them, and their strengths and limitations across market environments.

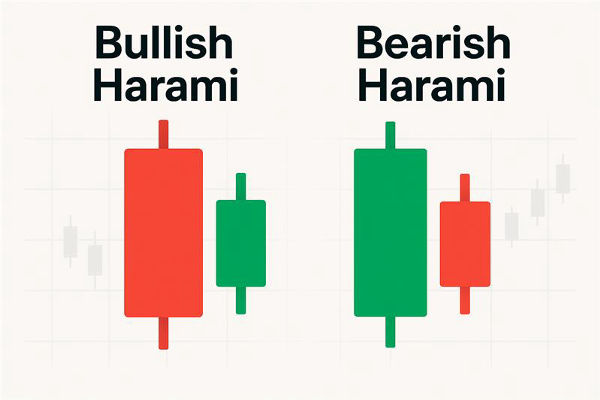
A Harami pattern spans two bars:
A large "parent" candle in the prevailing trend direction.
A smaller "baby" candle, whose entire real body sits within the parent's body.
Visually, this appears as a smaller candle "inside" a larger one—hence the Japanese term for "pregnant." It suggests indecision, exhaustion, or a pause in momentum. Harami patterns can signal bullish reversals in downtrends or bearish reversals at tops.

Anatomy
Occurs within a downtrend.
The first bar is a long bearish candle.
The second is a smaller bullish candle, completely inside the prior's body.
The large bearish candle indicates strong selling. The small bullish candle, however, suggests sellers may be losing their grip, giving bulls a footing, especially in oversold territory.
Confirmation
Confirmation comes when the price:
Breaks above the high of the baby candle.
Follows rising volume, bullish RSI divergence, or MACD crossovers.
Trading the Bullish Harami
Entry point: break above the second candle's high.
Stop-loss: below the baby's low.
Target: next resistance zone, moving average, or Fibonacci level.
Consider using RSI to confirm oversold conditions.

Anatomy
Appears during an uptrend.
The first candle is a large bullish bar.
The second is a smaller bearish bar, well-contained within the first.
Market Message
The big bullish bar shows strong buying, but the second's hesitation implies that bullish momentum is faltering, potentially signalling a top.
Confirmation
Look for a break below the baby candle's low, ideally supported by:
Decreasing RSI or stochastic cross, or High-volume bearish signal.
Trade Setup
Short entry: below the confirmation bar's low.
Stop-loss: above the baby candle's high.
Target: near support, moving average, or measured move.
| Feature | Bullish Harami | Bearish Harami |
|---|---|---|
| Trend context | Appears in downtrends | Appears in uptrends |
| First candle | Long bearish candle | Long bullish candle |
| Second candle | Small bullish candle inside prior body | Small bearish candle inside prior body |
| Psychological signal | Buyers are entering after initial selling | Sellers appearing after buying pressure |
| Confirmation trigger | Break above baby’s high | Break below baby’s low |
1) With RSI or MACD
Use RSI 70 with a bearish Harami. MACD crossovers add weight to the signal.
2) Near Fib Levels or MAs
Harami near Fibonacci retracement zones or key MAs increases the probability of a valid reversal.
3) Volume Attention
A high-volume second bar improves the signal. Low-volume baby bars should be treated with caution.
4) Time Frame Considerations
Most reliable on daily or weekly charts. Avoid intraday false signals unless confirmed by volume and structure.
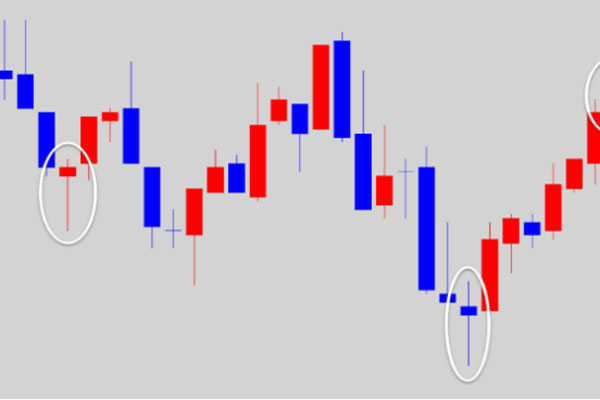
Bullish Harami with Confirmation
After a 4-week slide, the price hits support and a bullish Harami forms, followed by a strong bullish candle. RSI shows oversold — long entry made, stop just below Harami low, target set at recent resistance.
Failed Bearish Harami
In a strong rally, a bearish Harami appears but is succeeded by sideways consolidation before continuing an upward trend. Lesson: Harami can signal indecision, not reversal.

1. Recognise market context: Confirm trend direction and support/resistance zones.
2. Spot the pattern: Look for perfect containment of the baby candle within the parent.
3. Look for confirmation: Require breakout bar plus an indicator signal.
4. Execute with discipline: Define entry, stop-loss, and take-profit levels.
5. Manage risk: Position size per trade should align with risk tolerance (1–2% account max).
Appearing after sustained trends at key support or resistance.
In conjunction with indicators suggesting overbought or oversold conditions.
During volume-backed reversals, a transition between buyers and sellers.
Avoid trading Harami setups in choppy, range-bound markets or without indicator alignment.
| Pros (Advantages) | Cons (Limitations) |
|---|---|
| Easy to identify with a simple two-candle formation | Weaker signal compared to patterns like Engulfing or Evening Star |
| Offers early insight into potential trend reversals | Requires confirmation to reduce false signals |
| Works well with technical indicators like RSI, MACD, and volume | Can produce misleading signals in sideways or low-volume markets |
| Provides defined entry and stop-loss levels for risk management | Limited predictive power in shorter timeframes like 1-minute or 5-minute charts |
| Useful for both bullish and bearish reversal setups | May be ignored in strong trending environments where reversal is less probable |
The Harami is a two-candle reversal pattern, derived from the Japanese word for "pregnant". It consists of a large "mother" candle followed by a smaller "baby" candle, where the second candle's body is completely contained within the body of the first.
The Harami is considered a reliable reversal indicator, especially when it appears at the end of a long trend or at key support/resistance levels.
A Harami Cross is a variation where the second (small) candle is a Doji or a candle with an extremely small body (little to no price change). The Harami Cross is considered a stronger warning signal of a pending reversal than a regular Harami, as it shows complete indecision
While Harami patterns can appear on any timeframe, they are most reliable on higher timeframes such as Daily or Weekly charts. They are less effective for scalp trading on 1-minute or 5-minute charts because of increased market noise.
In conclusion, the Harami candlestick pattern is a subtle yet valuable reversal tool. It offers a heads-up on shifting sentiment but requires patient confirmation.
When paired with structure, indicators, and sound trade management, Harami patterns can be an effective method of timing entries without excessive risk.
Disclaimer: This material is for general information purposes only and is not intended as (and should not be considered to be) financial, investment or other advice on which reliance should be placed. No opinion given in the material constitutes a recommendation by EBC or the author that any particular investment, security, transaction or investment strategy is suitable for any specific person.