Published on: 2025-06-11
In candlestick trading, understanding price action patterns is key to identifying market sentiment and potential reversals. Two of the most commonly observed patterns are the Inside Bar and the Outside Bar formations.
While they may appear similar at first glance, these candlestick patterns reveal very different market dynamics and trading opportunities. In this article, we'll break down the core differences between Inside Bar vs Outside Bar patterns, explain what they signal about price behavior, and help you determine when and how to trade each effectively.

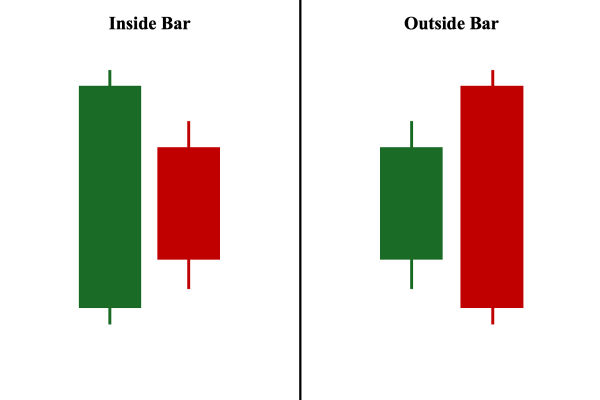
The inside bar candle is one of the simplest yet most effective candlestick patterns in technical analysis. It occurs when a candle's high and low prices fall within the range of the previous candle. This formation signals market consolidation and often precedes a breakout.
Traders rely on this setup to identify low-risk trade entries, especially during trending markets. The inside bar candle represents a period of indecision where buyers and sellers are in temporary equilibrium. However, this often serves as a precursor to sharp price moves when the market chooses a direction.

In contrast, an outside bar candle pattern forms when the current candle's high is higher than the previous candle's high, and the low is lower than the previous candle's low. This pattern reflects heightened market volatility and a significant shift in trader sentiment.
An outside bar suggests that the market has expanded beyond the previous range, which could be due to a surge in volume or breaking news. It's a more aggressive signal than the inside bar, often indicating strong momentum in either direction.
The psychological forces behind the inside bar candle and outside bar differ significantly. Inside bars signal pause and contraction. They often form during periods of market indecision or consolidation. This makes them particularly useful for breakout strategies.
On the other hand, outside bars show dominance. The market has moved with force in both directions before closing decisively. This indicates that one side—bulls or bears—has taken control. Outside bars are frequently found during high-impact sessions or trend reversals.
Understanding these psychological nuances allows traders to better interpret price action and anticipate potential setups based on the market's underlying behaviour.
The inside bar candle is typically used in Breakout trading strategies. Traders often wait for the price to break above or below the mother bar (the candle before the inside bar) to signal trade entry. The logic is that a breakout from this range will lead to a continuation of the previous trend or a new movement altogether.
Inside bars work best when they appear after strong directional moves. In such cases, they act as a pause before the next leg up or down. This allows traders to enter with tight stop losses and defined risk, making them especially appealing for trend-followers.
While the inside bar candle is more passive in nature, the outside bar offers an aggressive trading signal. When an outside bar forms after a downtrend with a strong close near the high, it is often considered a bullish reversal pattern. Conversely, when it forms after a rally and closes near the low, it may indicate bearish pressure.
Outside bars are not typically used in breakout strategies. Instead, traders rely on them as signs of momentum and trend exhaustion. Some traders consider an outside bar to be a standalone reversal signal, especially if it forms at support or resistance levels.

There is no clear winner between the inside bar candle and the outside bar in terms of reliability. The effectiveness of each depends on the context in which it appears. For example, an inside bar on a higher timeframe following a clear trend can be more reliable than a random outside bar on a lower chart.
What matters more is how these patterns are used in conjunction with other tools such as trendlines, moving averages or support and resistance zones. The inside bar is great for anticipating breakouts, while the outside bar excels in identifying strong momentum shifts.
Many seasoned traders use both patterns within the same strategy, adapting their approach based on market conditions.
One common error traders make is treating the inside bar candle as a guaranteed signal rather than a setup. A breakout from an inside bar can be false, especially in choppy markets. It's important to wait for confirmation, such as volume or a retest of the breakout level.
With outside bars, a mistake often lies in reacting too quickly. Because the pattern can be volatile, entering without context or ignoring nearby support and resistance can result in losses. Always consider the broader trend and whether the market conditions support the signal given by either pattern.
Choosing between an inside bar candle and an outside bar depends on your trading style. If you prefer waiting for quiet setups with a defined risk, inside bars are ideal. They offer cleaner entries and are easier to manage in terms of stop-loss placement.
For traders who thrive in volatile markets or who are looking to catch trend reversals, outside bars may provide more relevant opportunities. Their forceful nature makes them suitable for trades that depend on sudden price changes.
Ultimately, the key is to apply both patterns in a structured, rule-based strategy that accounts for confirmation signals and market context.
The inside bar candle and the outside bar are two powerful patterns that can enhance your Price Action Trading skills. Though they appear similar, their implications and use cases are different. Understanding when and how to apply each pattern can lead to more informed decisions and potentially better trade outcomes.
By recognising the unique characteristics of each and avoiding common pitfalls, traders can use these tools to identify quality setups, improve timing, and manage risk more effectively. Both patterns have stood the test of time and continue to play a valuable role in modern technical analysis.
Disclaimer: This material is for general information purposes only and is not intended as (and should not be considered to be) financial, investment or other advice on which reliance should be placed. No opinion given in the material constitutes a recommendation by EBC or the author that any particular investment, security, transaction or investment strategy is suitable for any specific person.