Published on: 2023-09-21
Updated on: 2026-05-19
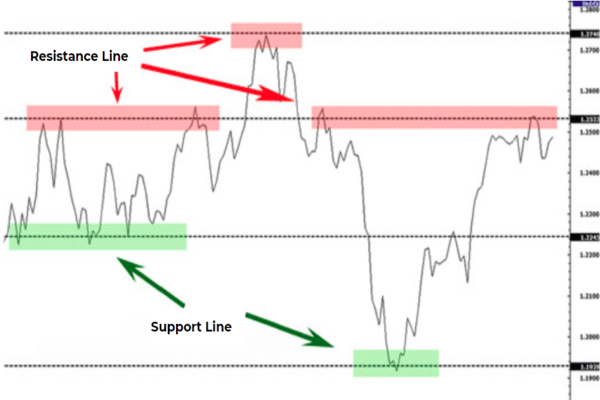
Support and resistance line analysis helps traders see where price pressure may shift before entry. It shows where buyers have defended price, where sellers have blocked advances, and where a breakout may change control.
That matters today because markets react quickly to inflation data, rate expectations, geopolitical risk, and liquidity shifts. Gold briefly exceeded $4,300 per ounce in October 2025 before easing back, showing why support and resistance lines should be treated as flexible zones rather than perfect lines. 
A support line marks a price area where buying interest has repeatedly slowed or stopped a decline.
A resistance line marks a price area where selling pressure has repeatedly capped an advance.
Stronger levels usually appear on higher timeframes, have clean reactions, and sit near round numbers, pivots, prior highs, or prior lows.
Broken resistance can become support, while broken support can become resistance after a retest.
Breakouts need confirmation from a candle close, volume, momentum, or a successful retest.
Support and resistance line analysis works best with risk management, not as a standalone forecast.
A resistance line is a level or zone where the price has tried to rise but failed to sustain the move higher. It often forms after buyers take profit, short sellers enter, or momentum weakens near a previous high. Traders draw it by connecting at least two meaningful swing highs.
A support line is a level or zone where the price has tried to fall but failed to continue lower. It forms when buyers become more active, sellers lose control, or short sellers close positions near a previous low. Traders draw it by connecting at least two meaningful swing lows.
The key is to think in zones. Price rarely matches exactly. It may pierce a line, trigger stops, and reverse. A useful support or resistance line marks an area of reaction.
Support and resistance line transformations are among the most practical aspects of technical analysis.
When price breaks above a resistance line, that old resistance can become new support. Traders who missed the breakout may buy the retest. Short sellers may cover. Existing buyers may add exposure because the previous ceiling has become a potential floor.
When price breaks below a support line, that old support can become new resistance. Trapped buyers may sell into the rebound to reduce losses. New sellers may treat the failed support as confirmation that the market has weakened.
This role reversal helps traders avoid chasing every breakout. A clean break matters, but the retest often shows whether the market accepts the new range.
The original rule is useful: a line connected by more price points is usually stronger than one connected by only two. But that is not enough.
Strength also depends on timeframe, reaction quality, recency, confluence, and volatility. Weekly and monthly levels usually carry more weight than intraday levels. Sharp rejections matter more than weak pauses. Round numbers, moving averages, pivot points, and prior highs or lows can strengthen a zone.
The S&P 500’s May 2026 technical map shows this in practice. Barchart’s trader cheat sheet uses end-of-day prices to identify pivot points, support levels, resistance points, and volatility-based ranges. That is how support-and-resistance line analysis becomes a trading framework rather than a drawing exercise.
Support and resistance at different time levels should be read from large to small.
Start with the monthly or weekly chart to identify levels that major participants may notice. These levels are cleaner and more useful for understanding the bigger trend.
Then move to the daily chart. Daily support and resistance lines help traders plan entries, exits, and stop placement within the broader structure.
Intraday charts are useful for timing, but they should not override a major higher-timeframe level. A five-minute breakout into weekly resistance is not strong simply because the small chart looks bullish.
A simple process works: mark weekly zones, refine daily levels, use intraday charts for timing, and remove weak lines.
The breakthrough buying method is triggered when the price breaks above a resistance line. The signal suggests buyers have absorbed supply and pushed prices into a higher range.
The risk is a false breakout. A spike above resistance can fail quickly if volume is weak or if the candle closes back below the level. Traders often wait for a close above resistance, stronger momentum, or confirmation from the next candle.
The callback buying method waits for the price to break resistance, then returns to test the old resistance as support. This method is slower, but it often gives a cleaner risk point.
The weakness is that strong markets may not return to the breakout level. Price can continue higher without offering a perfect entry. Traders must choose between early participation and better risk control.
Support and resistance lines also help define exits. A long trade can place a stop slightly below a support zone. A short trade can place a stop slightly above a resistance zone.
The stop should not sit exactly on the line. Markets often test obvious levels before reversing. A small buffer beyond the zone can reduce unnecessary stop-outs, but position size must be adjusted.
Good support-and-resistance line analysis starts with restraint. If a chart needs ten lines to explain the trade, the setup is probably unclear.
Use these rules: draw only levels that changed price behaviour, prefer zones when reactions are uneven, use candle bodies when closes matter most, use wicks when rejection points are obvious, and separate higher-timeframe levels with different colours or line styles.
Recheck old levels after major news, earnings, central-bank decisions, or large gaps. Market context can quickly change the value of a support or resistance line.
The existing article image should remain because it supports the beginner explanation. The caption can be improved to: “Support and resistance lines show price zones where buyers or sellers have repeatedly reacted.”
Do not draw too many lines. A crowded chart makes every move look important.
Do not treat support and resistance as guaranteed turning points. They are decision zones, not promises.
Do not ignore market context. A support line during quiet trading may fail quickly after an inflation surprise, a central-bank decision, or a geopolitical shock. In volatile conditions, the zone must be wider and the position size smaller.
They are useful, but not guaranteed. Reliability improves when the level is visible on a higher timeframe, has clean reactions, and is confirmed by price action, volume, or momentum.
Use the method that captures the clearest reaction. Candle bodies show where the market closed. Wicks show where the price was rejected. Often, the best level is a zone that includes both.
Use only the levels that affect the next decision. Most charts need one or two nearby support zones and one or two nearby resistance zones. Extra lines usually add noise.
Support and resistance line analysis remains useful because it turns price history into practical trading decisions. It helps traders identify where buyers and sellers have acted before, where risk can be managed, and where a breakout may signal a change in control.
The best approach is simple: draw fewer levels, use zones, start from higher timeframes, wait for confirmation, and size trades around the risk. In fast markets today, that discipline matters more than the line itself.
Disclaimer: This material is for general information purposes only and is not intended as (and should not be considered to be) financial, investment or other advice on which reliance should be placed. No opinion given in the material constitutes a recommendation by EBC or the author that any particular investment, security, transaction or investment strategy is suitable for any specific person.