Published on: 2025-09-08
Updated on: 2025-09-09
When learning technical analysis, beginners often focus only on price charts, forgetting that volume plays an equally important role in trading. One of the best tools that combines both price and volume is the Accumulation Distribution Indicator (A/D Indicator).
This indicator helps traders identify whether a stock, currency pair, or commodity is being accumulated (bought) or distributed (sold) by large players, even if price action alone doesn't make it obvious.
In this beginner's guide, we will explain what the Accumulation Distribution Indicator is, how it works, its formula, strategies, advantages, limitations, and practical examples to help you trade smarter.

The Accumulation Distribution Indicator is a volume-based technical analysis tool created by Marc Chaikin. It measures the cumulative flow of money into and out of an asset by analysing both price and volume.
Accumulation = Institutional or retail investors are actively buying.
Distribution = Institutional or retail investors are selling.
Unlike simple volume indicators, the A/D line also considers where the price closed within a trading period, making it more accurate in assessing real buying or selling pressure.

The A/D Indicator calculates a Money Flow Multiplier and multiplies it by volume to determine whether money is flowing into or out of an asset.
If the stock closes near the high of the day, it suggests accumulation.
If it finishes close to the day's low, it indicates distribution.
If it closes in the middle of the range, the reading is neutral.
They then add the value to the cumulative A/D line. This creates a continuous line on the chart that moves up or down depending on whether buying or selling pressure dominates.
1) Money Flow Multiplier (MFM):
MFM=((Close value – low value) – (high value – close value)) / (high value – low value)
2) Money Flow Volume (MFV):
MFV=MFM×Volume
3) Accumulation Distribution Line:
A/D=PreviousA/D+MFV
This formula ensures that the analysis considers both price movement and volume strength, making the indicator more reliable than volume alone.
Example:
Suppose a stock has the following values for the day:
High: 120
Low: 100
Close: 118
Volume: 1,000,000
MFM = (118−100)−(120−118)(118-100) - (120-118)(118−100)−(120−118) ÷ (120-100) = (18 - 2) ÷ 20 = 0.8
MFV = 0.8 × 1,000,000 = 800,000
A/D Line = Previous A/D + 800,000
The positive value shows accumulation (buying pressure).
1) Rising A/D Line
If the A/D line rises while the price also rises, it confirms strong buying pressure.
2) Falling A/D Line
If the A/D line falls while the price falls, it confirms strong selling pressure.
3) Bullish Divergence
If price is falling but the A/D line rises, it suggests hidden accumulation and a potential bullish reversal.
4) Bearish Divergence
If price rises but the A/D line falls, it suggests hidden distribution and a potential bearish reversal.
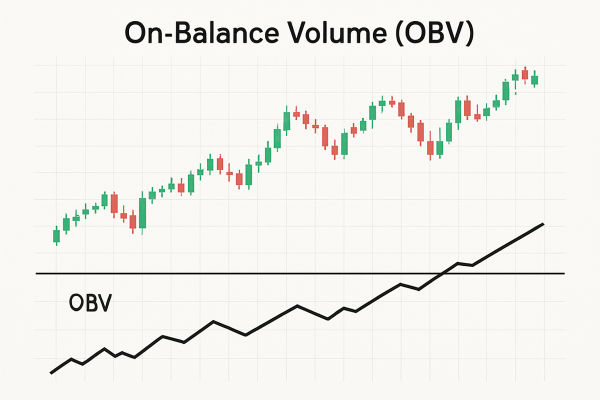
| Feature | Accumulation Distribution (A/D) | On-Balance Volume (OBV) |
|---|---|---|
| Considers closing price relative to range | Yes | No |
| Accounts for buying/selling pressure strength | Yes | No |
| Simpler calculation | More complex | Simpler |
| Better for divergences | Yes | Sometimes misleading |
In short, the A/D indicator is more detailed than OBV because it integrates price position within the day's range.

Traders often use the A/D line to confirm whether a trend is strong or weak.
If both price and the A/D line rise, it indicates a strong bullish trend.
If both fall, it's a strong bearish trend.
The most popular strategy is trading divergences.
Bullish Divergence: Price makes lower lows while the A/D line makes higher lows → Buy signal.
Bearish Divergence: Price makes higher highs while the A/D line makes lower highs → Sell signal.
For better accuracy, traders often combine the A/D line with:
RSI for momentum confirmation.
Moving Averages to identify long-term trend direction.
MACD for entry and exit timing.
For beginners, the A/D indicator is a great way to look beyond simple price charts. It gives insights into what's happening behind the scenes, whether big institutions are buying or selling. This helps traders avoid false breakouts and improves overall decision-making.
Tips for Beginners Using the A/D Indicator
Always confirm A/D signals with other indicators such as the RSI or MACD.
Use it on higher timeframes (4H, daily) for more reliable signals.
Avoid trading based only on A/D divergences in highly volatile markets.
Practice on demo accounts before applying it to live trades.
The Accumulation Distribution Indicator (A/D) is a volume-based tool that measures the flow of money into or out of an asset by analysing both price and volume to show whether it is being accumulated (bought) or distributed (sold).
Traders use it to confirm price trends, spot divergences that may signal reversals, and combine it with RSI or MACD for more accurate entry and exit points.
Yes, the A/D line is widely used in forex trading to identify hidden buying or selling pressure in currency pairs, helping traders spot potential reversals or confirm trends.
The A/D Indicator can produce inaccurate signals in volatile or low-volume markets, and it does not indicate precise entry or exit levels; therefore, it is most effective when combined with other technical tools for validation.
In conclusion, the Accumulation Distribution Indicator is one of the most reliable tools for beginners who want to understand the real strength behind price movements.
In 2025, as markets become more volatile and competitive, having an extra layer of insight through the A/D indicator can make the difference between random trades and calculated decisions.
Disclaimer: This material is for general information purposes only and is not intended as (and should not be considered to be) financial, investment or other advice on which reliance should be placed. No opinion given in the material constitutes a recommendation by EBC or the author that any particular investment, security, transaction or investment strategy is suitable for any specific person.