Equal Lows (EQLs) are a critical concept in understanding market structure and the behaviour of institutional participants.
Recognising these levels enables traders to anticipate potential market reactions, align with smart money activity, and increase the probability of successful trades.
This article provides a detailed exploration of EQLs, including their identification, significance, and practical applications within Smart Money Concepts (SMC).
EQL Unveiled: Understanding Market Signals
1. Definition and Significance
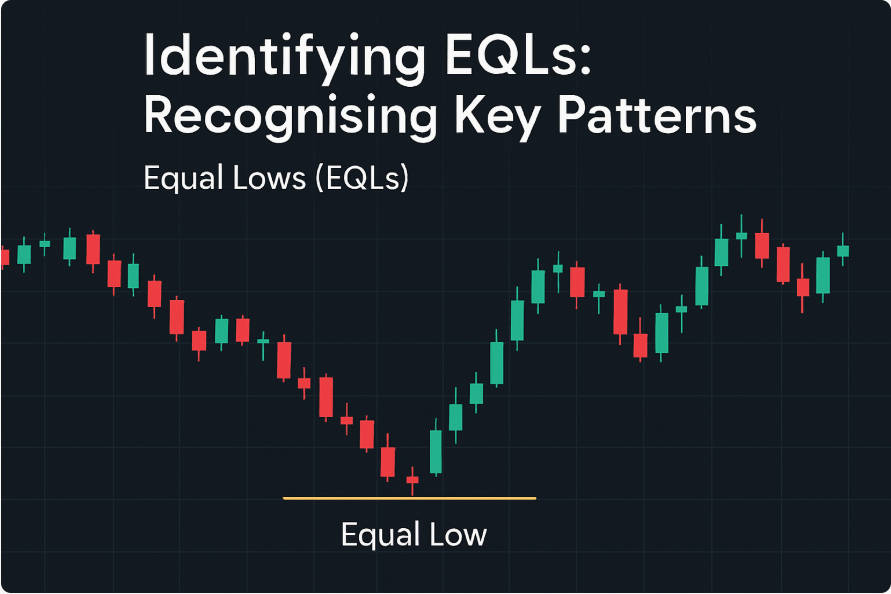
An Equal Low occurs when the market revisits a previous low, creating a horizontal support level. This recurrence signals that buyers consistently defend this price area, suggesting potential reversal or consolidation.
2. Relevance in Smart Money Concepts
Within SMC, EQLs are more than mere support levels; they represent areas of institutional interest. Observing these levels allows traders to infer where large participants may be accumulating or distributing positions, offering insight into forthcoming market movements.
Identifying EQLs: Recognising Key Patterns

1. Visual Identification
EQLs appear as horizontal lines on charts where the market tests the same low multiple times. They typically coincide with swing lows and indicate strong buyer interest.
2. Analytical Tools
Automated Indicators:
Platforms such as TradingView offer indicators for Equal Highs and Lows, providing clear visual markers for these levels.
Manual Charting:
Traders can draw horizontal lines at prior lows and monitor price behaviour around these levels to identify potential EQL formations.
EQL in Market Structure: Signals of Trend Dynamics
1. Role in Trend Analysis
EQLs are instrumental in defining market structure. In an uptrend, where higher highs and higher lows dominate, revisiting a prior low without breaking it forms an EQL. This may indicate continuation of the trend or a potential reversal.
An EQL can highlight a shift in market behaviour, known as a Change of Character. Observing price interaction with an EQL can signal weakening momentum or an impending trend reversal.
Liquidity and EQL: Insights into Institutional Activity
1. Liquidity Pools
EQLs often coincide with areas where stop-loss orders accumulate. Such clusters create liquidity, which institutional participants may target to execute large trades without significant slippage.
2. Institutional Behaviour
Monitoring price action at EQLs allows traders to infer institutional activity. Rapid price movements away from an EQL may indicate order execution by smart money, while the inability to break the EQL could signify accumulation or distribution phases.
Trading EQLs: Strategies for Enhanced Probability
1. Entry Strategies
Breakout Entries: Initiating positions when price breaks above an EQL, signalling a bullish trend.
Retest Entries: Waiting for price to retest an EQL following a breakout, providing improved risk-to-reward ratios.
2. Risk Management
3. Confirmation Techniques
Advanced Tactics: Combining EQLs with SMC Concepts

1. Strategic Confluence
Common Pitfalls and How to Avoid Them
Premature Entries:
Entering trades without confirming a breakout or retest of an EQL increases the risk of false signals.
Ignoring Broader Market Context:
Failing to consider overall market structure can lead to misinterpretation of EQL significance.
Neglecting Volume:
Overlooking trading volume may result in missed opportunities or unreliable signals.
Conclusion: The Strategic Value of EQLs
EQLs represent more than simple support levels; they provide insight into market psychology and institutional strategy. Mastering their identification and application enables traders to make more informed decisions, anticipate key market movements, and align with smart money flows.
Incorporating EQL analysis into trading strategies enhances precision, risk management, and overall performance in diverse market conditions.
Detailed EQL Trading Reference Table
| Market Context |
EQL Type |
Entry Signal |
Stop-Loss |
Target |
Notes / Example |
| Uptrend |
Single EQL |
Bullish candle close above EQL |
Just below EQL |
Recent swing high |
EUR/USD 1.0800 → retest → bullish engulfing |
| Uptrend |
Double Bottom |
Break above mid-peak between lows |
Below lowest EQL |
Next resistance |
GBP/USD 1.3050 → double bottom → breakout |
| Downtrend |
Single EQL |
Bearish close below EQL |
Just above EQL |
Recent swing low |
AUD/JPY 90.50 → retest → bearish candle |
| Sideways / Consolidation |
Multiple EQL |
Bounce confirmation at support |
Below EQL |
Resistance / consolidation top |
USD/JPY 145.20 → multiple touches → bullish candle |
| Trend Reversal |
Triple Bottom |
Breakout of neckline |
Below lowest EQL |
Pattern height |
NZD/USD 0.6320 → triple bottom → breakout |
| Smart Money Confluence |
EQL + Order Block |
Retest at EQL + order block |
Just below EQL |
Next key resistance |
EUR/GBP 0.8600 → retest → confirmation candle |
Frequently Asked Questions
1. What exactly is an Equal Low (EQL)?
An Equal Low occurs when the market revisits a previous swing low, forming a horizontal support level. It signals consistent buying interest at that price and often highlights potential areas for trend reversal or continuation.
2. How does EQL differ from regular support levels?
While all EQLs are support levels, not all support levels qualify as EQLs. EQLs are defined by multiple touches at the same price without being broken, often attracting institutional activity and forming liquidity pools, which standard support levels may not.
3. Why are EQLs important in Smart Money Concepts (SMC)?
EQLs represent areas of institutional interest. Observing price behaviour at EQLs allows traders to anticipate where smart money is accumulating or distributing positions, which is crucial for aligning trades with high-probability setups.
4. Can EQLs indicate trend reversals?
Yes. An EQL can signify a potential trend reversal, particularly when it coincides with a Change of Character (CHoCH), double bottom patterns, or increased volume confirming strong buying pressure.
5. Are EQLs reliable in all market conditions?
EQLs are more reliable when considered within the broader market structure and confirmed by volume, liquidity, and other SMC tools. They can be less effective in highly volatile or news-driven markets without additional confirmation.
Disclaimer: This material is for general information purposes only and is not intended as (and should not be considered to be) financial, investment or other advice on which reliance should be placed. No opinion given in the material constitutes a recommendation by EBC or the author that any particular investment, security, transaction or investment strategy is suitable for any specific person.


