Published on: 2025-08-29
Updated on: 2026-07-06
OBV, or On-Balance Volume, is a technical indicator that helps traders see whether price movement is supported by real trading activity. Price shows where a market closed. OBV shows whether volume is flowing with that move or quietly moving against it.
Price action alone does not always reveal whether buyers or sellers are genuinely participating in a move. A breakout may look strong, but if OBV fails to rise, the move may lack conviction. A sideways market may look inactive, but rising OBV can suggest accumulation before price catches up. In today’s markets, where ETF flows, algorithmic execution, crypto derivatives, and short-dated options can all affect liquidity, volume confirmation remains a valuable trading filter.

OBV adds volume when price closes higher and subtracts volume when price closes lower.
Rising OBV usually suggests buying pressure, while falling OBV points to selling pressure.
OBV divergence can warn when price momentum is not supported by volume.
The indicator works best with support, resistance, trendlines, RSI, MACD, or moving averages.
In forex, OBV often uses tick volume, so it should be interpreted with extra caution.
On-Balance Volume is a cumulative volume indicator created by Joseph Granville in the 1960s. Its purpose is simple: measure whether volume is entering or leaving a market.
The absolute OBV number is not the main focus. Traders pay close attention to the OBV line's direction, slope, and whether it confirms or contradicts price action. If price rises while OBV rises, buyers are supporting the trend. If price rises while OBV falls, the rally may be losing strength.
OBV is commonly used in stocks, ETFs, futures, commodities, crypto, and forex. It is especially useful when traders want to confirm breakouts, identify accumulation, or detect early signs of distribution.
OBV uses three calculation rules:
| Price Condition | OBV Calculation |
|---|---|
| Today's close is higher than the previous close | Previous OBV + current volume |
| Today's close is lower than the previous close | Previous OBV − current volume |
| Today's close is unchanged | OBV remains unchanged |
Most trading platforms calculate OBV automatically. Still, understanding the formula helps traders read the indicator more accurately.
OBV does not measure how much price moved. It only checks whether the closing price moved up, down, or stayed flat compared with the previous close. Then it adds or subtracts the full period’s volume.
Assume a stock starts with an OBV value of 0.
| Day | Closing Price | Volume | OBV Calculation | OBV Value |
|---|---|---|---|---|
| Monday | $20.00 | 10,000 | Starting point | 0 |
| Tuesday | $21.00 | 12,000 | 0 + 12,000 | 12,000 |
| Wednesday | $20.50 | 8,000 | 12,000 − 8,000 | 4,000 |
| Thursday | $21.50 | 15,000 | 4,000 + 15,000 | 19,000 |
| Friday | $21.50 | 9,000 | No change | 19,000 |
In this example, price rises from $20.00 to $21.50, while OBV rises from 0 to 19,000. The advance is therefore supported by net positive volume flow. If price rose but OBV moved lower, the trend would look weaker.
On most charts, OBV appears as a line below the price chart. Traders compare the OBV line with price highs, lows, support, resistance, and trend direction.
A healthy bullish trend often shows price making higher highs while OBV also makes higher highs. A healthy bearish trend often shows price making lower lows while OBV also falls. Problems appear when price and OBV stop moving together.
For example, if price breaks above resistance but OBV remains below its prior high, the breakout may lack participation. If OBV breaks above resistance before price does, it can suggest that volume is building ahead of the price breakout becoming visible.
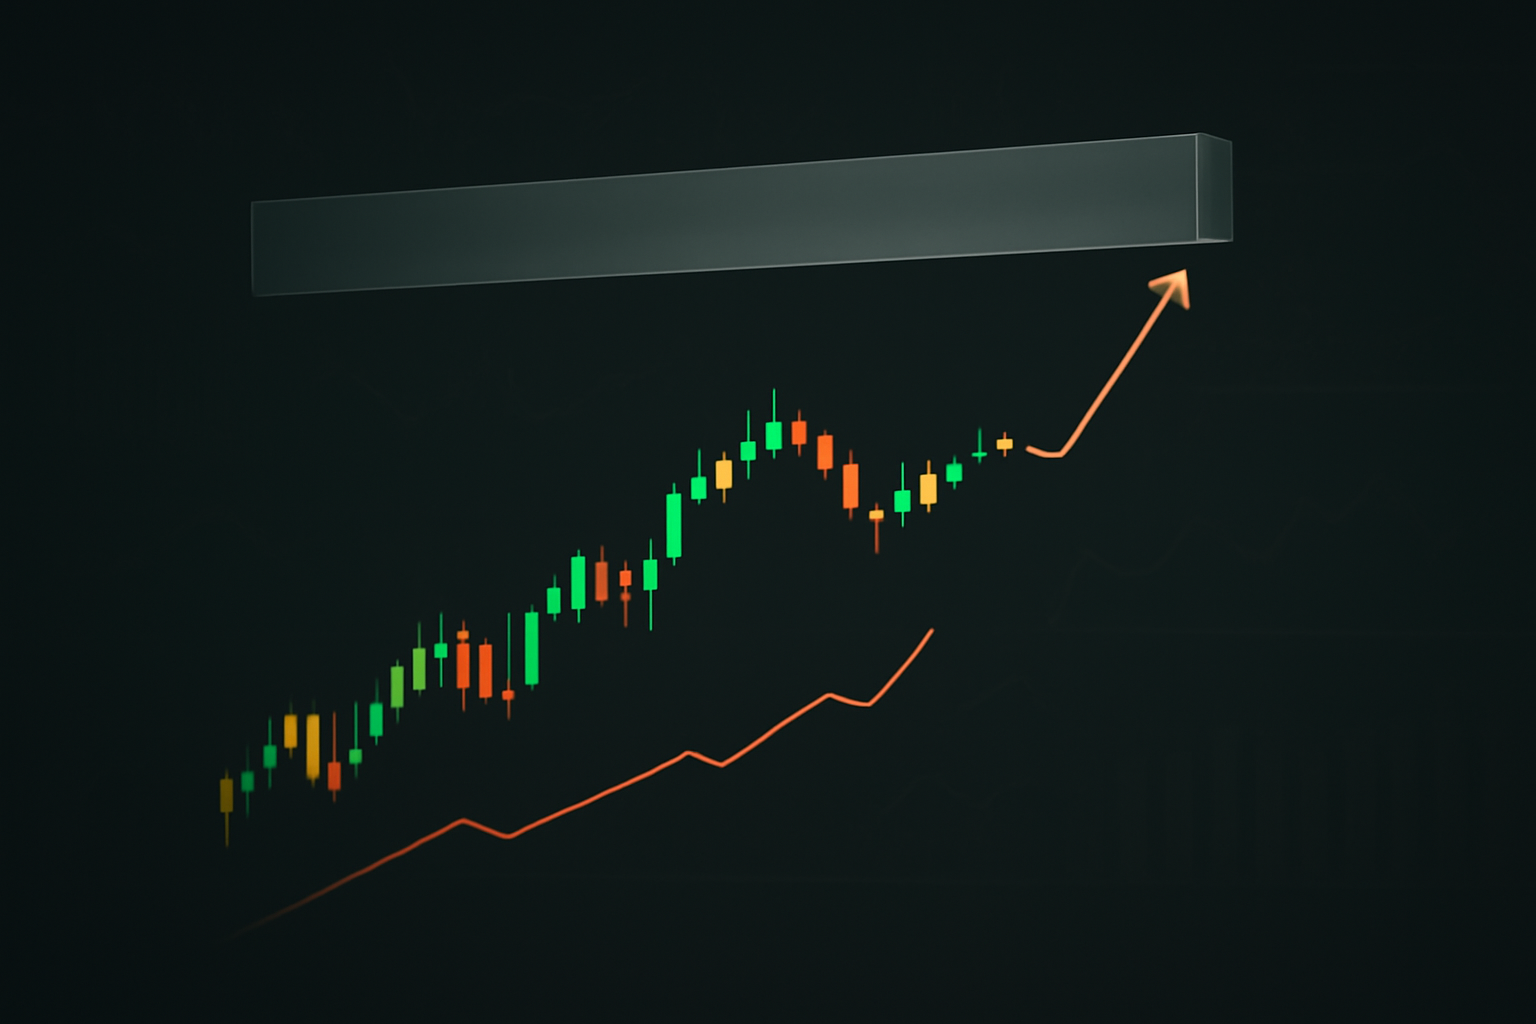
OBV is best used as a confirmation tool. It should not replace price analysis, but it can strengthen or weaken a trading view.
Rising OBV suggests that volume is stronger on up-closing periods than on down-closing periods. This often points to accumulation. If price also trends higher, OBV confirms bullish pressure.
Falling OBV suggests that volume is heavier on down-closing periods. This can point to distribution or selling pressure. If price is also breaking support, falling OBV confirms bearish momentum.
When price moves sideways, but OBV rises, traders may be seeing early accumulation. Buyers may be entering before price breaks out of the range.
When price rises, but OBV falls, the rally may be fragile. Price is moving higher, but volume does not confirm the move. This can warn of a failed breakout or coming pullback.
Divergence is one of the most important OBV signals. It happens when price and OBV move in different directions.
| Divergence Type | Price Action | OBV Action | Possible Meaning |
|---|---|---|---|
| Bullish Divergence | Price makes a lower low | OBV makes a higher low | Selling pressure may be fading |
| Bearish Divergence | Price makes a higher high | OBV makes a lower high | Buying pressure may be weakening |
Bullish divergence does not mean traders should buy immediately. It means downside pressure may be losing strength. Traders usually wait for price to break above resistance, reclaim a moving average, or form a higher low.
Bearish divergence works the same way in reverse. It warns that a rally may be losing volume support. Confirmation usually comes when price breaks below support or fails to hold a breakout.
A stock trades sideways below the $100 resistance. Price has tested the level several times but has not closed above it. During the range, OBV continues to rise and eventually breaks above its previous high.
That tells traders volume is improving before price confirms the move. If the stock closes above $100 and OBV continues to rise, the breakout will have stronger confirmation. If price breaks above $100 but quickly falls back below it while OBV turns lower, the breakout is less reliable.
Price creates the trade setup. OBV helps determine whether the breakout has meaningful participation behind it.
A crypto pair rises from $60,000 to $66,000, then pushes to a new high of $68,000. Price looks bullish, but OBV forms a lower high during the second move.
That shows price has advanced without stronger volume support. If price then falls below short-term support, the bearish divergence becomes more meaningful. Traders may view that as a warning of a deeper correction or failed breakout.
The divergence itself is not a sell signal. It only suggests that buying pressure is no longer confirming the advance.
OBV works differently depending on the market.
| Market | OBV Usefulness | Key Caveat |
|---|---|---|
| Stocks | Strong | Reported exchange volume is transparent |
| ETFs | Strong | Rebalancing and fund flows can create volume spikes |
| Futures | Strong | Contract rollover can affect volume readings |
| Crypto | Useful | Exchange volume quality varies by venue and pair |
| Forex | Limited but Still Useful | Most platforms use tick volume, not centralized traded volume |
In stocks and ETFs, OBV is often more reliable because volume is reported through centralised exchanges. In futures, traders should be aware of contract rollovers, which can distort volume comparison between contracts.
In crypto, OBV can be useful for major, liquid pairs, but volume quality varies by exchange and instrument. Spot volume, perpetual futures volume, and exchange-specific liquidity can tell different stories.
Forex requires the most care. Spot forex is decentralised, so most retail platforms use tick volume. Tick volume measures how often the price updates, not the total market-wide trading volume. It can still show changes in activity, but it should be combined with session timing, spreads, volatility, and price structure.
OBV is straightforward, but its signals still require context.
First, OBV can produce false signals. Divergence may appear early and remain unresolved for several sessions. A market can continue trending even after OBV starts to weaken.
Second, a large-volume spike can distort the line. Earnings, index rebalancing, ETF flows, or sudden news can create unusual volume that affects OBV for several periods.
Third, OBV ignores the size of the price move. A small price gain with high volume adds the full volume, while a large price gain with low volume adds less. That can sometimes oversimplify market behaviour.
Best practice is to use OBV with price structure. Look for confirmation near support, resistance, trendlines, and moving averages. A bullish OBV signal near support is more useful than a random rise in the middle of a range. A bearish divergence near resistance is more important than one appearing in open space.
OBV is not the only volume-based indicator. Each tool reads volume differently.
| Indicator | Main Difference |
|---|---|
| OBV | Adds or subtracts volume based on whether price closes higher or lower |
| Accumulation/Distribution | Uses where price closes within the period's range |
| Volume Price Trend | Adjusts volume by the percentage price change |
| Money Flow Index | Combines price and volume into an oscillator |
OBV remains widely used because its interpretation is straightforward: either volume confirms price or it does not.
OBV is often used as a leading confirmation tool because volume can shift before price breaks out or reverses. However, it is calculated from past closing prices and volume, so traders should still wait for price confirmation before acting.
A bullish OBV signal appears when OBV rises with price, breaks above a previous OBV high, or forms bullish divergence while price tests support. The signal is stronger when price also breaks resistance or forms a higher low.
Bearish OBV divergence occurs when price makes a higher high, but OBV forms a lower high. It suggests the rally may be losing volume support. Traders usually wait for a support break or failed breakout before treating it as confirmation.
Yes, but with caution. Forex OBV usually uses tick volume rather than true centralised traded volume. It can help measure activity within a broker feed, but it should be confirmed with price action, volatility, session timing, and liquidity conditions.
OBV and RSI measure different things. OBV tracks volume flow, while RSI measures price momentum. Many traders use them together. A setup is stronger when OBV confirms accumulation and RSI supports momentum without showing exhaustion.
At its core, OBV attempts to answer a single question: is volume supporting the price move? Rising OBV confirms buying pressure. Falling OBV confirms selling pressure. Divergence warns that price and volume are no longer aligned. The indicator is most useful when combined with support, resistance, trend structure, and other technical tools.
For stocks, ETFs, futures, and liquid crypto markets, OBV can be a strong confirmation tool. In forex, it remains useful but requires caution, as tick volume differs from that on centralised exchanges. Used correctly, OBV adds a valuable layer of evidence before traders commit to a breakout, reversal, or trend-following setup.
Disclaimer: This material is for general information purposes only and is not intended as (and should not be considered to be) financial, investment or other advice on which reliance should be placed. No opinion given in the material constitutes a recommendation by EBC or the author that any particular investment, security, transaction or investment strategy is suitable for any specific person.