The Inner Circle Trader (ICT) strategy, developed by Michael J. Huddleston, is a trading methodology that emphasises understanding market structure, liquidity, and institutional order flow.
This approach aims to align retail traders with the movements of "smart money" — large financial institutions that significantly influence market dynamics.
By focusing on price action and the behaviour of institutional traders, ICT provides a framework for identifying high-probability trading opportunities.
What Is ICT Trading?

As mentioned above, ICT trading is a methodology that combines technical analysis with insights into institutional trading behaviour. Unlike traditional retail strategies that rely heavily on indicators, ICT emphasises price action, market structure, and liquidity to anticipate market movements.
The core idea is understanding how and where institutional traders will execute orders, allowing retail traders to position themselves advantageously.
Timing and Sessions
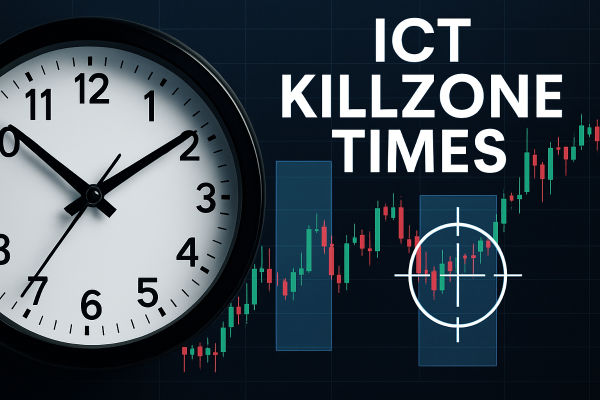
ICT emphasises that institutions operate with precision and often execute their moves during key sessions:
These are the most volatile times and tend to produce setups in line with the institutional narrative. Trading outside these windows often results in chop and indecision.
Core Concepts of ICT Trading
1. Market Structure
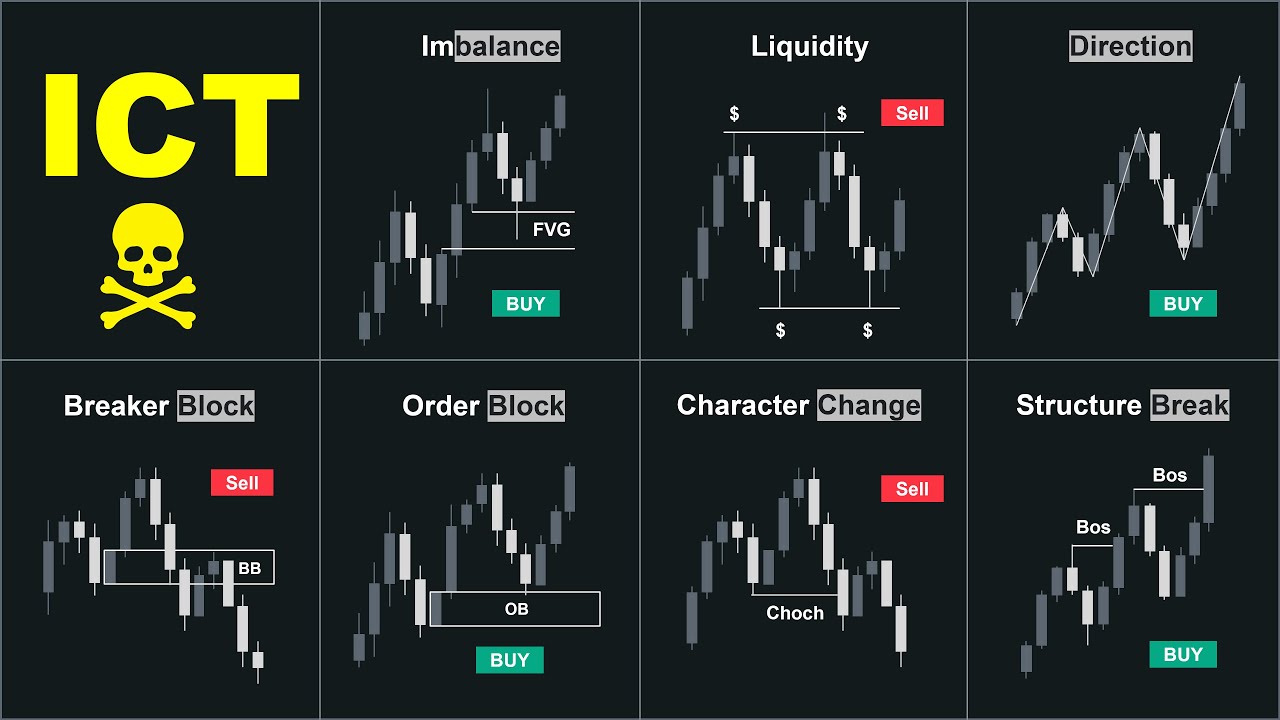
Market structure is the foundational concept in ICT trading. It refers to the behaviour of price action through a series of higher highs and higher lows (bullish) or lower highs and lower lows (bearish).
In ICT, traders are taught to pay attention to breaks in market structure because they often signal a change in directional bias. For example, if a bullish trend breaks a previous higher low, that may indicate bearish intent. Conversely, a break above a recent lower high may show a potential bullish reversal.
Market structure in ICT is dynamic, not static, meaning traders must constantly monitor swing points to see how price interacts with key levels that institutions may be defending or attacking.
2. Liquidity Pools
Liquidity is the fuel of the financial markets. ICT teaches that the market seeks liquidity to facilitate large institutional orders.
There are two main types of liquidity pools:
Buy-side liquidity: Above old highs, where stop-losses for short trades accumulate.
Sell-side liquidity: Below old lows, where stop-losses for long trades accumulate.
These zones are like magnets for price, and ICT traders use them to anticipate potential reversals or continuations. When institutions push prices into these zones, they trigger retail stop orders to fill huge institutional positions. Recognising these moves can provide traders with optimal entry points.
3. Order Blocks
Order blocks are consolidation or accumulation/distribution where large institutional traders have placed buy or sell orders. These are often found before a strong directional move and are used as references for future support or resistance.
A bullish order block is typically the last down candle before an upward move. A bearish order block is the last up candle before a massive decline. ICT traders look for a price to return to these areas and then take trades in the direction of the original move, assuming institutions are defending their positions.
These zones provide:
Potential entries
Tight stop placements
Context for trade bias
4. Fair Value Gaps (FVGs)
Fair Value Gaps are areas on the chart displaying a rapid price move with little to no trading activity between two candles. In a bullish market, it's a gap between a candle's high and the low of two candles later; in a bearish market, it's the reverse.
Institutions may revisit these gaps to rebalance orders and fill liquidity voids. ICT traders watch these zones closely, as price often reacts to them with precision. An FVG that aligns with other concepts like market structure breaks or order blocks becomes a high-probability area.
5. Optimal Trade Entry (OTE)
The OTE entry technique uses Fibonacci retracements (typically the 61.8% to 79% zone) to find low-risk, high-reward trade setups after a market shift in structure. Once market structure shifts bullish or bearish, traders wait for a retracement into the OTE zone before entering a trade in the new direction.
ICT stresses waiting for confirmation in these zones — like rejection candles, liquidity grabs, or alignment with a higher time-frame bias — before taking a position.
6. Judas Swing
The Judas Swing is a concept where the market initially moves in one direction (often against retail traders), only to reverse and follow the real institutional direction.
It commonly occurs at the beginning of massive sessions (London or New York open) and serves to manipulate retail traders before the real move begins.
ICT traders anticipate Judas Swings by identifying the previous day's high/lows and the first hour's price action, watching for false breakouts that reverse sharply.
ICT Trading Strategies

1. liquidity sweep Reversal
This strategy involves identifying liquidity pools above or below recent highs/lows and trading the reversal after the price takes out these stops.
Process:
Mark a recent high or low.
Wait for a sweep (stop hunt) during a key trading session.
Look for rejection at an order block or FVG.
Enter in the opposite direction with a stop-loss just beyond the sweep.
2. Break in Market Structure + OTE
This strategy looks for a clear shift in structure and then uses the Fibonacci OTE zone to enter a trade with minimal risk.
Steps:
Identify a swing high/low break that indicates a shift.
Draw a Fib retracement from the recent low to high (or vice versa).
Wait for the price to enter the OTE zone (61.8–79%).
Enter trade with Confluence like a Fair Value Gap or an order block.
3. breaker block Strategy
Breaker blocks are failed order blocks that act as strong support or resistance zones when the price returns. ICT traders use this when a previous order block is violated, but then hold the price from the opposite side.
Use Case:
After a false breakout, wait for the price to retest the broken level.
Trade the rejection for confirmation.
4. FVG Rebalance Entry
This approach focuses on trading into or from fair value gaps.
Steps:
Identify FVGs on the 1h or 15m chart.
Wait for the price to enter the gap and show rejection.
Use confirmation like a rejection wick, or a shift in market structure.
5. Asia Range Liquidity Raid
ICT outlines that the Asian session often sets a range, and the London or new york session will raid either end of the range before reversing.
Process:
Mark the high and low of the Asian session.
Watch for a false breakout of that range.
Take trade in the opposite direction when the price rejects the raid.
Conclusion
In conclusion, ICT trading provides a comprehensive framework for understanding market movements through the lens of institutional behaviour.
While the methodology requires dedication and practice, it offers beginners the potential for more informed and strategic trading decisions that align with the actions of major market players.
Disclaimer: This material is for general information purposes only and is not intended as (and should not be considered to be) financial, investment or other advice on which reliance should be placed. No opinion given in the material constitutes a recommendation by EBC or the author that any particular investment, security, transaction or investment strategy is suitable for any specific person.


