Understanding market direction is the backbone of profitable trading. Leading indicators provide early signals about potential price movements, helping traders stay ahead of the curve.
In 2025, with the rise of algorithmic trading and global volatility, using the right tools is more crucial than ever. This guide explores the top 10 leading indicators every trader should master for smarter decision-making in the trading markets.
Leading Indicators in Trading: Explained
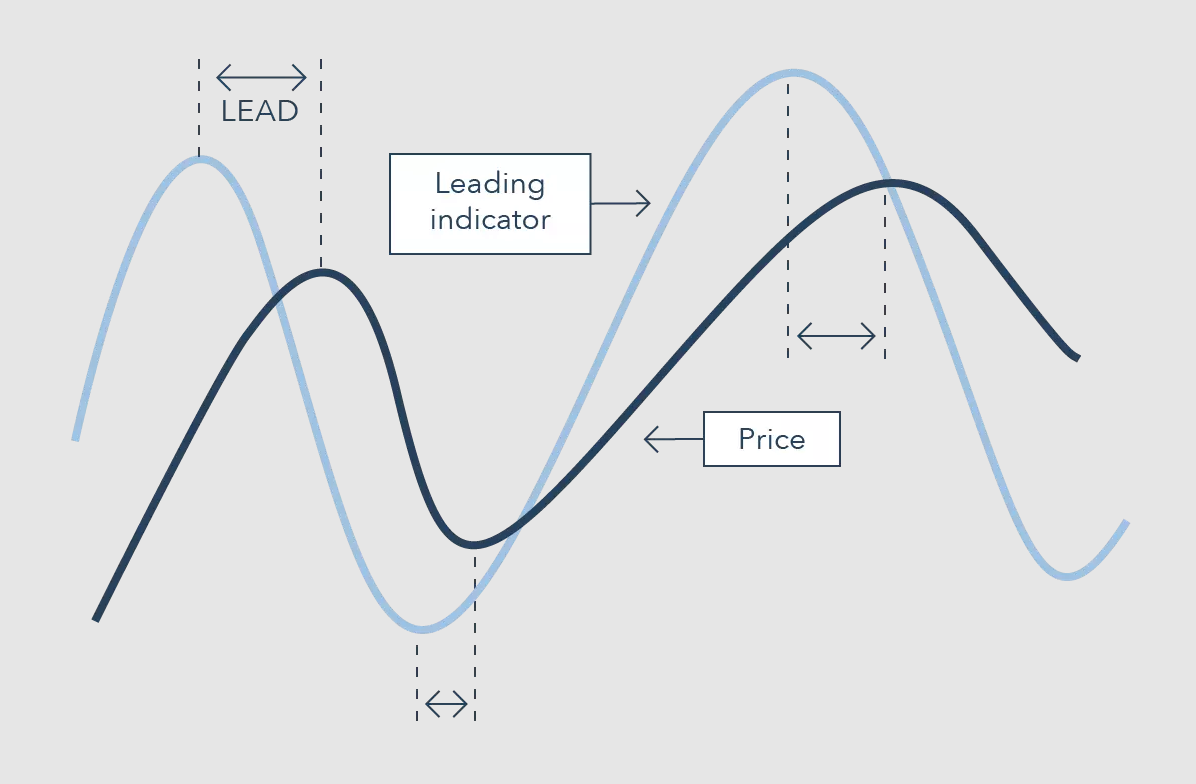
Leading indicators are technical tools that forecast future price action. Unlike lagging indicators, which confirm trends after they've started, leading indicators help traders anticipate trend changes, reversals, or potential breakouts.
These tools are particularly useful in fast-moving or highly speculative markets where timing is crucial.
Why Does It Matter in 2025?
In 2025, markets have become more interconnected than ever. Traders face global macroeconomic factors, rapid shifts, and algorithmic volatility. Leading indicators provide a competitive edge by offering early signals—often before the crowd reacts.
As trading evolves, these indicators remain essential in crafting timely entry and exit strategies.
Top 10 Leading Indicators in Trading
1. Relative Strength Index (RSI)
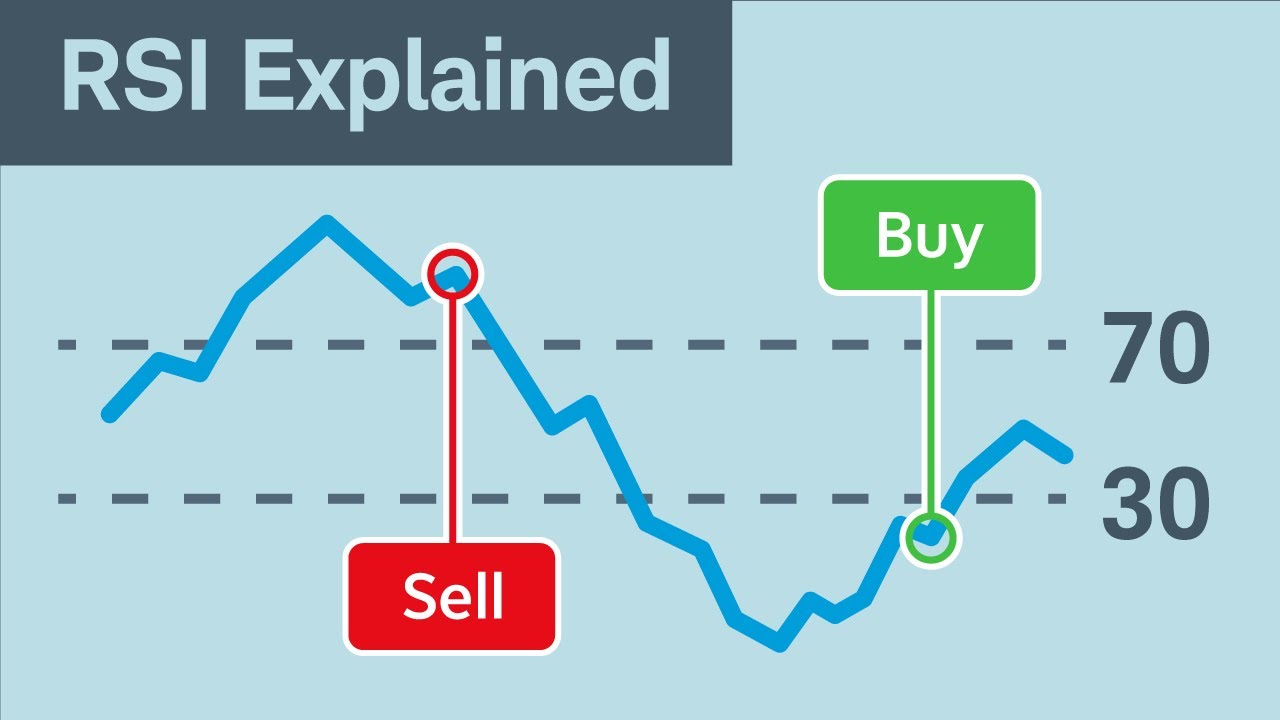
The RSI is a momentum oscillator that measures the speed and change of price movements. It oscillates between 0 and 100 and is primarily used to identify overbought or oversold conditions.
When the value is above 70, it may indicate an overbought market that is likely to experience a pullback. Conversely, when it drops below 30, it suggests an oversold condition that could precede a bounce.
Traders also use RSI divergence—when the price moves in the opposite direction of RSI—for early trend reversal alerts.
2. Stochastic Oscillator
This indicator compares a particular closing price to a range of prices over a set period. It works best in sideways or range-bound markets and consists of two lines: %K and %D.
The stochastic oscillator can pinpoint turning points before they occur. When both lines cross above 80, the market is considered overbought. When they cross below 20, it is considered oversold. Crossovers of %K and %D lines themselves can act as early trade signals.
3. Moving Average Convergence Divergence (MACD)
Although often labelled a lagging indicator, the MACD also provides leading signals through histogram analysis and divergence patterns. It's made up of the MACD line, signal line, and histogram.
MACD divergence—where the price creates a new high or low, but the MACD fails to follow—often signals an upcoming reversal. Histogram flips can also precede trend changes, giving traders advance notice.
4. On-Balance-Volume (OBV)
OBV is a volume-based leading indicator that connects price movement with trading volume. The idea is simple: volume precedes price.
If volume increases while the price remains unchanged, a breakout is likely approaching. Conversely, if the price rises with decreasing volume, the uptrend may lack strength. The on-balance volume (OBV) helps to confirm trends and anticipate reversals before they become evident.
5. Volume Price Trend (VPT)
VPT builds upon OBV by combining price changes and volume data into a single line. It is more sensitive and can reveal changes in investor behaviour before the price reacts.
When the VPT line trends upward faster than the price, accumulation may be happening behind the scenes. When it falls even as prices remain stable, it hints at quiet distribution—a bearish sign.
6. Fibonacci Retracement Levels
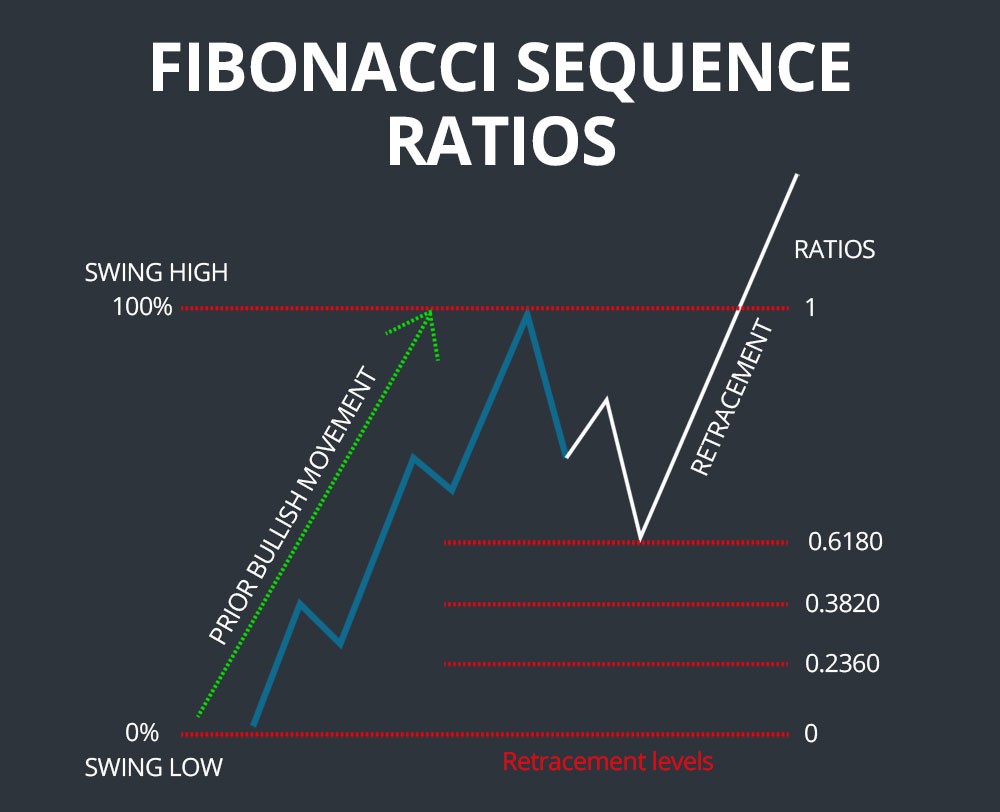
These are horizontal lines that indicate potential support and resistance levels based on key Fibonacci ratios (23.6%, 38.2%, 50%, 61.8%, and 78.6%).
Traders use Fibonacci retracement to anticipate where the price might reverse during pullbacks. These levels often align with other key zones or indicators, creating high-probability trade areas in advance.
7. Bollinger Bands Width (BBW)
Although Bollinger Bands are typically viewed as a volatility tool, the distance between the bands can serve as a leading indicator. A contraction of the bands (indicating low volatility) often foreshadows a significant price move in either direction.
Monitoring the Bollinger Band Width allows traders to prepare for breakout opportunities before they occur rather than reacting afterwards.
8. Average Directional Index (ADX) with DMI
The ADX indicates trend strength, while the Directional Movement Index (+DI and -DI) reveals trend direction. When +DI crosses above -DI and the ADX is rising, a strong uptrend may be forming.
These crossovers can act as early warning systems for the start of a trend. Watching ADX in tandem with DMI helps traders enter at the beginning of new price movements rather than chasing trends.
9. Ichimoku Kinko Hyo (Cloud Indicator)
This Japanese charting system is a multi-component indicator offering support and resistance, trend direction, and momentum—all in one.
The leading spans A and B create the "cloud," which projects future levels of equilibrium. If the price crosses above the cloud, a bullish trend may be forming.
When the price dips below the cloud, a bearish setup may emerge. Traders often enter positions before the complete trend develops based on how the components align.
10. Pivot Points
Originally used by floor traders, pivot points can identify potential turning points in the market during the current or next session.
Based on the high, low, and close of the previous period, these levels indicate support and resistance. Traders often utilise them in intraday or swing trading to predict potential market reactions before reaching those areas.
Case Studies: Leading Indicators in Action
Case 1: RSI Divergence Signals Reversal in EUR/USD
In early 2025, the EUR/USD pair was showing an upward trend. However, the Relative Strength Index (RSI) indicated a bearish divergence as the price reached a new high.
Traders who recognised this divergence either closed their long positions or opened short positions, successfully capitalising on the sharp reversal that occurred afterwards.
Case 2: Bollinger Band Squeeze Predicts Breakout in Tesla
Tesla's stock experienced low volatility for days, with Bollinger Bands narrowing significantly. A breakout above the upper band triggered a 15% surge within two days, validating the predictive power of the squeeze.
Case 3: Pivot Points Mark Resistance in S&P 500
The S&P 500 approached a daily pivot resistance at 5,000. The market stalled and reversed on lower volume, giving swing traders a clean short setup. Combining the pivot level with OBV analysis confirmed the low conviction behind the rally.
Tips for Beginners:
Always confirm a leading signal with price action
Use higher timeframes for context, lower timeframes for entry
Combine volume and momentum for stronger setups
Set alerts instead of manually monitoring charts 24/7
Conclusion
In conclusion, leading indicators offer traders a glimpse into the future. In 2025, where volatility and speed define the markets, mastering these tools can give you a decisive edge.
However, no indicator is foolproof. Pairing them with sound risk management, a strong mindset, and ongoing education is what ultimately builds long-term success in trading.
Disclaimer: This material is for general information purposes only and is not intended as (and should not be considered to be) financial, investment or other advice on which reliance should be placed. No opinion given in the material constitutes a recommendation by EBC or the author that any particular investment, security, transaction or investment strategy is suitable for any specific person.
