Published on: 2025-08-07
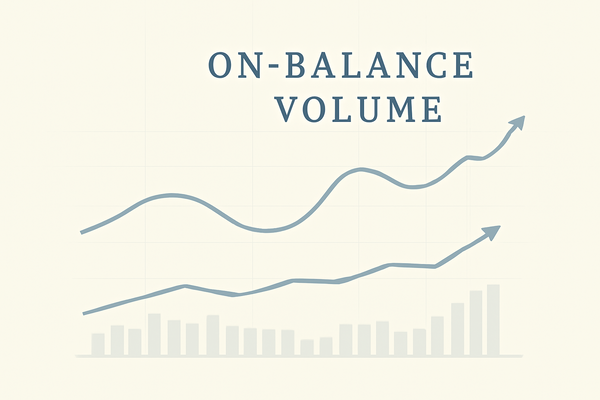
In trading, OBV stands for On-Balance Volume, a cumulative volume indicator that assesses total buying and selling activity.
Pioneered by Joseph Granville in the 1960s, OBV helps traders anticipate price movements by tracking whether volume is supporting or diverging from price action.
In this guide, we'll break down what OBV stands for, its calculation and interpretation, its strengths and limitations, and how to use it strategically in your trading.

As mentioned above, the OBV, or On‑Balance Volume, is a powerful technical indicator used to gauge market momentum through volume behaviour.
Developed by Joseph Granville, a notable financial analyst who introduced OBV in his 1963 book, Granville's New Key to Stock Market Profits.
Granville's insight was that significant volume shifts often preceded meaningful price moves, likening OBV's rise to a tightly wound spring ready to burst.

OBV's calculation is straightforward:
If today's closing price is higher than yesterday's:
Current OBV = Previous OBV + Today's Volume
If today's closing price is lower than yesterday's:
Current OBV = Previous OBV – Today's Volume
If today's closing price equals yesterday's:
Current OBV = Previous OBV
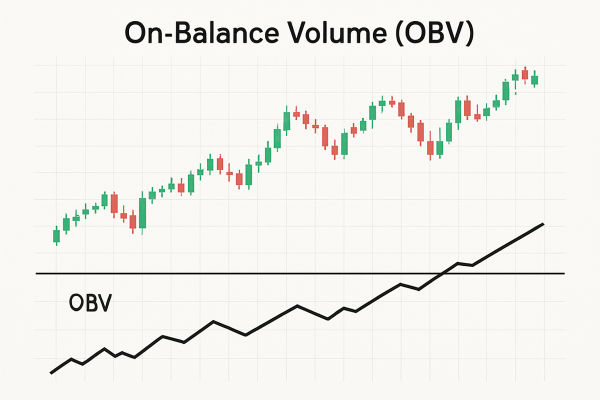
Since OBV is cumulative, its absolute value matters less than its slope and direction. A rising OBV implies accumulation (buying), while a falling OBV indicates distribution (selling)
OBV's underlying logic is that volume leads price. Sharp volume increases may precede rallies even if the price hasn't yet reacted, and decreasing volume can warn that an upward trend may falter. By comparing OBV and price movements:
Convergence (OBV and price move together) confirms trend strength.
Divergence (price rises but OBV falls, or vice versa) signals a potential reversal.
OBV also offers insights into institutional activity. Major players often move markets using volume first, before price reflects their positions. OBV can capture these underlying shifts

Trend Confirmation
When both price and OBV are making higher highs and higher lows, uptrend strength is confirmed. The same applies inversely for downtrends.
Divergence Analysis
Observing a price increase without OBV confirmation (steady or falling) could indicate a weakening uptrend and an upcoming pullback. Conversely, OBV rising while price stalls suggests hidden buying strength.
Breakout Signals
In times of congestion or when testing support/resistance, breakouts in OBV (either upward or downward) can precede price breakouts, particularly when confirmed by volume.
While OBV works across stocks, indices, forex, and commodities, its effectiveness may vary:
Stocks & Indices: OBV is most commonly used here, as volume transparency is often highest.
Forex & Commodities: Since centralised volume data may be lacking, some platforms approximate OBV or favour price-based alternatives.
OBV performs best on daily and weekly charts as longer timeframes reduce noise and improve trend validity. Short-term charts may deliver false signals due to transient fluctuations in volume.
Strengths
Simple to calculate and understand.
Helps confirm trends and uncover hidden buying pressure.
Adds volume perspective to price analysis.
Detects divergences, giving early warning signals
Limitations
Lagging nature: OBV reflects past moves, not forward-looking changes.
False signals: In choppy or range-bound markets, divergence may be misleading.
Volume dependency: OBV is only as strong as the volume data behind it, and is misleading in low-quality or synthetic data environments
Best Practices:
Bundle OBV with other indicators such as trend, momentum, or price action for better signal validation. Utilise divergence solely when the context is appropriate, and utilise it on larger timeframes and refrain from excessive application in low-volume phases.
Activate OBV on your chart platform and watch its trend.
Confirm Trends: Look for aligned price and OBV trends.
Spot Divergences: Identify when price and OBV signals conflict.
Validate Breakouts: Use OBV surges as tone-setters for breakouts or pullbacks.
Add Filters: Combine OBV with RSI, MACD, or volume-based metrics to improve efficiency.
Test and Track: Backtest for historical accuracy and maintain a journal for live validation.
1. What Is the Full Form of OBV in Trading?
Answer: OBV stands for On-Balance Volume. It's a technical analysis indicator that uses volume flow to predict changes in stock prices by measuring cumulative buying and selling pressure.
2. Is OBV Suitable for Beginners in Trading?
Answer: Yes, OBV is beginner-friendly due to its simplicity. It doesn't require complex inputs and works well as a confirmation tool when used with trendlines, RSI, or moving averages.
3. What's the Difference Between OBV and Volume Indicators?
Answer: OBV tracks cumulative volume based on price direction, while regular volume indicators show raw volume traded per period. OBV gives more context by combining volume with price trends.
In conclusion, the On-Balance Volume (OBV) indicator offers invaluable insight into market sentiment by layering volume context under price trends.
While not foolproof, it's a must-have tool, especially when paired with complementary indicators and disciplined strategy.
Disclaimer: This material is for general information purposes only and is not intended as (and should not be considered to be) financial, investment or other advice on which reliance should be placed. No opinion given in the material constitutes a recommendation by EBC or the author that any particular investment, security, transaction or investment strategy is suitable for any specific person.