In financial markets, price action doesn't always trend upward or downward. In many cases, markets move sideways, stuck between support and resistance, creating what's known as a ranging market.
While trends offer momentum, ranging markets provide opportunities for short-term gains, especially for range-bound or mean-reversion strategies.
This article provides a comprehensive guide to what a ranging market is, why it occurs, how to identify it, and most importantly, how to trade it effectively using tested strategies.
What Is a Ranging Market?
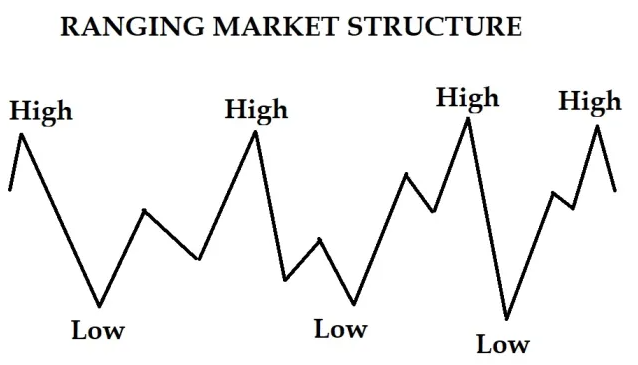
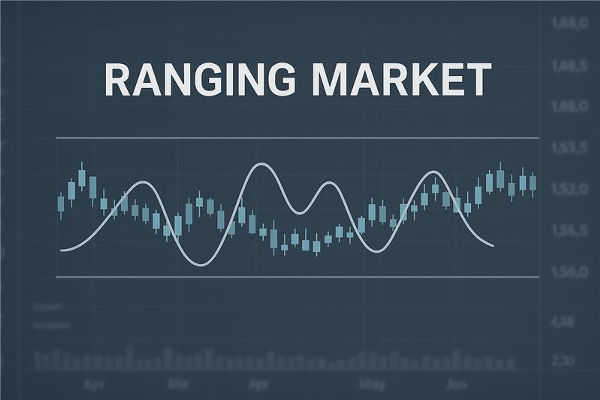
A ranging market, referred to as a sideways or consolidating market, is a situation where the price oscillates between distinct support and resistance levels without demonstrating a clear upward or downward trend. In this situation, neither purchasers nor vendors exert significant influence over the market, resulting in the price fluctuating within a horizontal range.
Unlike trending markets, which feature higher highs and higher lows (in an uptrend) or lower highs and lower lows (in a downtrend), ranging markets typically feature similar highs and lows over time. These price levels act as temporary ceilings (resistance) and floors (support), trapping price action between them.
Ranging conditions can last for hours, days, or even weeks, depending on the asset and the trading timeframe.
Examples
Many assets frequently range under certain conditions:
Forex: Currency pairs such as EUR/USD and AUD/JPY often enter range-bound phases during Asian or late U.S. sessions.
Stocks: Stocks might move sideways before earnings announcements or economic events.
Indices: The S&P 500 or NASDAQ often range during consolidation periods between news catalysts.
Commodities: Gold and oil occasionally move within horizontal ranges due to a balance between supply and demand.
Ranging behaviour occurs across all timeframes, from 5-minute to weekly charts, making range strategies adaptable for both day traders and swing traders.
Key Characteristics
First, the price typically oscillates between a horizontal support level and a resistance level. These levels tend to be clearly defined and frequently tested. Price repeatedly fails to break above resistance and below support, creating a choppy appearance on the chart.
Volume often declines during ranging conditions, and most indicators, such as RSI or MACD, will move sideways, offering little directional guidance. Moving averages may also flatten out, further signalling a lack of momentum.
Volatility generally decreases during a range, unless the range forms just before a breakout. In that case, the compression of price often leads to explosive moves once the range breaks.
How to Identify
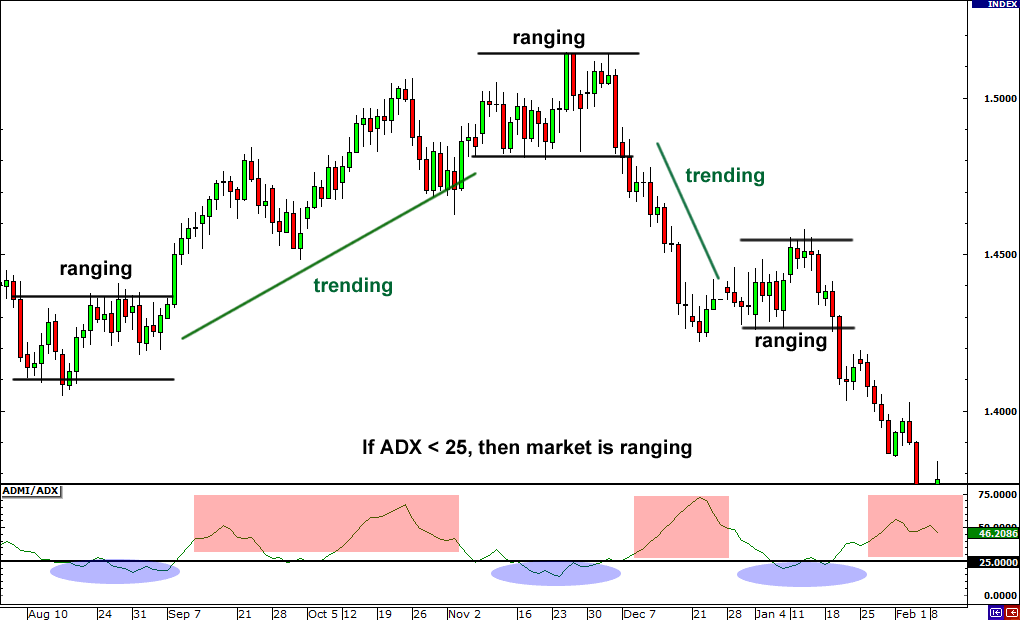
There are several ways to detect a ranging market on your chart. One of the simplest methods is visual inspection. If price fails to make higher highs or lower lows and continues to bounce between horizontal levels, it's likely in a range.
You can also use tools like Bollinger Bands, which tend to contract during consolidation phases. A narrowing of the bands often signals reduced volatility and a sideways market.
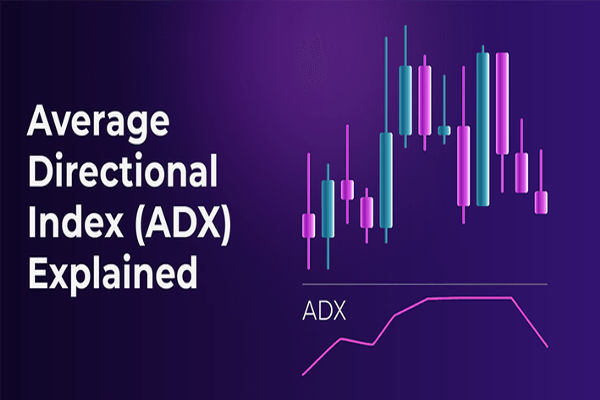
The Average Directional Index (ADX) is another useful indicator. An ADX value below 20 implies a weak trend or range-bound market.
Why Do Markets Range?
One of the primary causes is uncertainty. When traders anticipate new information, such as economic reports, central bank decisions, earnings announcements, or geopolitical incidents, they typically refrain from large positions. As a result, the price stalls.
Ranging markets also occur during periods of market exhaustion. After a strong trend, the price may consolidate before deciding its next direction. It is often referred to as a pause or distribution/accumulation phase, depending on whether it precedes a downtrend or an uptrend.
Additionally, low trading volume during off-peak hours can lead to range-bound movement, particularly in forex markets when major sessions are closed.
Trading Strategies for Ranging Markets
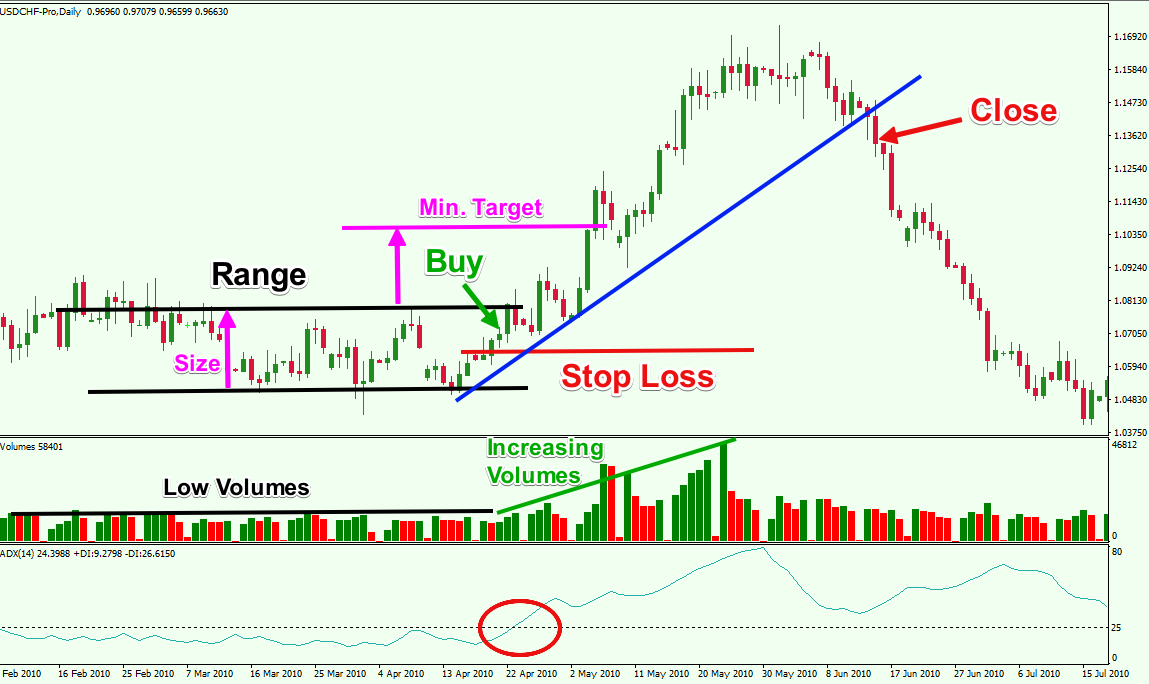
1. Range Reversal Strategy
This classic approach involves buying near support and selling near resistance. Confirmation tools such as candlestick patterns (e.g., hammers, pin bars, or engulfing candles) are used to validate reversals at key levels.
Indicators such as RSI can also help traders. If the RSI shows oversold conditions at support or overbought conditions at resistance, this supports a reversal setup. The goal is to profit from the price's repeated rejection of the range boundaries.
Stop-losses are typically placed just outside the support or resistance levels to protect against breakouts.
2. Bollinger Band Bounce
In a ranging market, Bollinger Bands tend to provide dynamic support and resistance. When the price touches the upper band, it often retraces toward the middle or lower band. Similarly, when it hits the lower band, it tends to bounce upward.
This strategy involves entering long trades near the lower band and short trades near the upper band while using the middle band (20-period moving average) as a potential exit or profit-taking point.
3. Stochastic Oscillator Crossovers
The stochastic oscillator is useful in identifying overbought and oversold zones within a range. When the stochastic crosses below 20, it may signal a buying opportunity near support. An indication of a shorting near resistance may arise when it surpasses 80.
This strategy is best when combined with price action signals and well-defined horizontal levels.
4. Breakout Preparation
While range trading is profitable during consolidation, many traders also prepare for the inevitable breakout. It involves closely monitoring volume, price compression, and time spent in the range.
Breakouts following extended consolidation are strong. You can set stop orders slightly above resistance and just below support to seize the next trend. It is known as a range breakout strategy and is ideal for catching early trend formation.
Ranging Market vs Trending Market
The strategies used in ranging markets are the opposite of those used in trending markets. In a trending market, traders follow the momentum. They buy breakouts or pullbacks in an uptrend and short rallies in a downtrend.
In a ranging market, however, traders do the reverse: they fade moves at the edges of the range and take profits near the opposite side. Trend-following indicators such as moving averages and MACD are less useful in ranging conditions.
The biggest mistake traders make is using the wrong strategy for the wrong market condition. Learning to identify whether a market is trending or ranging is one of the most important skills a trader can develop.
When Not to Trade
While range trading is a dependable strategy, it isn't always the best option. If a significant economic event is planned, such as a Federal Reserve statement or a Non-Farm Payrolls report, it's wise to refrain from trading the range. Such occurrences may result in unexpected surges and fluctuations in the market.
Also, avoid trading narrow ranges with little room for price movement. If the range is only 10-20 pips in forex or a small fraction of volatility in stocks, the risk-reward may not be favourable after accounting for spread and commissions.
In markets where range support and resistance levels are not clear or where price action is erratic, it's better to wait for a more defined structure.
Conclusion
In conclusion, while trending markets are more exciting, ranging markets offer consistent, repeatable trading opportunities. Achieving success in range trading depends on accurately recognising support and resistance, effectively utilising confirmation tools, and staying disciplined during uncertain times.
Whether you're scalping tight ranges or positioning for a breakout, a solid understanding of range dynamics will give you a powerful edge.
Disclaimer: This material is for general information purposes only and is not intended as (and should not be considered to be) financial, investment or other advice on which reliance should be placed. No opinion given in the material constitutes a recommendation by EBC or the author that any particular investment, security, transaction or investment strategy is suitable for any specific person.
