Published on: 2026-08-18
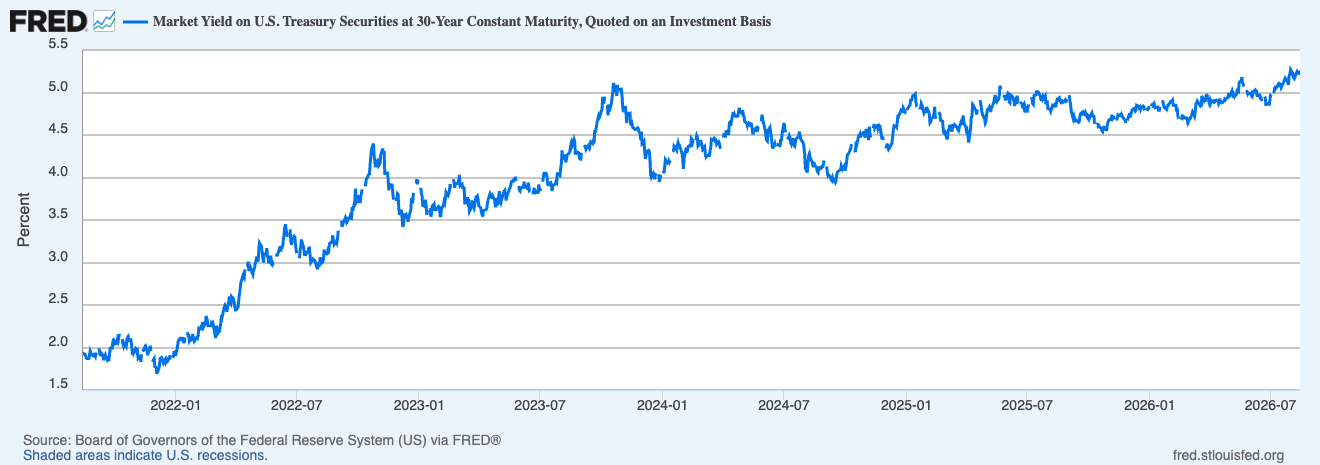
The 30-year Treasury yield rose about 4.5 basis points to 5.31% while the two-year added barely one to 4.18%, widening the 2s30s spread to roughly 113bp, its broadest since April.
CME pricing puts September Fed hike odds near 30%, down from around 60% following the July FOMC meeting.
San Francisco Fed modelling shows expected short rates edging lower while the 10-year term premium rose to 1.35%, from 1.31% on FOMC day.
The 30-year real yield climbed from 2.63% on 2 January to 3.06% on 17 August, tracking the nominal move almost basis point for basis point.
CBO now projects a $2.1 trillion fiscal 2026 deficit, with net interest through July up $117 billion on a larger debt stock and higher long-term rates.
The 30-year Treasury yield settled at 5.31% on Monday, 17 August, its highest close since 2007. Much of the past fortnight’s US economic data argued for the opposite. July payrolls shrank, retail sales posted their weakest month in over a year, headline and core inflation both cooled, and futures pricing for a September rate rise slid from better than even money after the July meeting to roughly 30%.
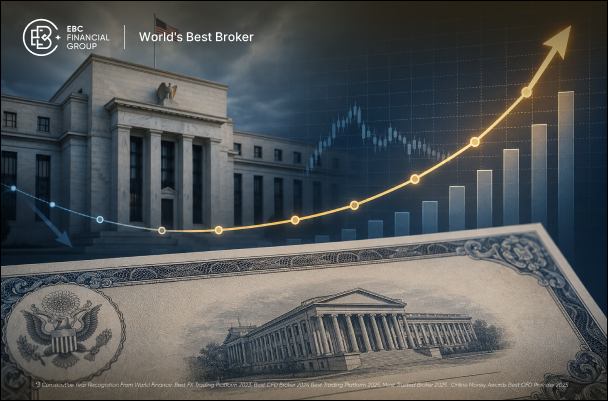
Short-dated Treasury yields have absorbed that message. Long-dated Treasury yields moved the other way, charging steadily more for the privilege of financing Washington across three decades.
Monday produced a textbook bear steepening in the US Treasury yield curve. The 30-year Treasury yield rose about four and a half basis points to 5.31%. The benchmark 10-year Treasury yield added close to three, reaching 4.72%.
The two-year, the maturity most tightly bound to near-term Fed policy, managed barely one and closed at 4.18%. Bond prices fall as yields rise, and the damage concentrated at the far end of the curve.
The immediate catalyst sits in the energy complex. Crude climbed as the 60-day deadline for a US-Iran settlement lapsed with Tehran ruling out an extension. Oil accounts for the last few basis points rather than the level. The long bond was already trading above 5.2% before Monday opened, and the session doubled as settlement day for the $25 billion of new 30-year bonds sold the previous week.
US economic data since the 29 July FOMC meeting has been consistently soft. Non-farm payrolls fell 23,000 in July against forecasts of an 83,000 gain, with May and June revised down by a combined 103,000. Retail sales dropped 0.6%, the steepest monthly decline in more than a year, and the control group feeding GDP slipped 0.4%. Headline CPI eased to 3.4% and core CPI to 2.5%, a five-month low.
The Federal Open Market Committee held the target range at 3.50% to 3.75% on a 9-3 vote, with three regional presidents dissenting in favour of a quarter-point hike. Rate futures have faded that hawkish bloc ever since, cutting the September hike probability from roughly 60% to near 30%. Two-year Treasury yields drifted lower in step, which is what receding tightening risk looks like in price.
A 30-year Treasury bond, however, is not a wager on the next meeting. It discounts the average expected policy rate across three decades plus the premium investors demand for locking capital away that long. Those components can travel in opposite directions, and through August they have.
The San Francisco Fed’s Treasury yield decomposition puts numbers on the divergence. Applied to the 10-year, the model splits a 14 August yield of 4.77% into an average expected overnight rate of 3.43% and a term premium of 1.35%. On 29 July, the day the FOMC held rates, the same model showed 4.75% divided into 3.44% and 1.31%.
Expected policy edged down. The term premium went up. The two-year decomposition repeats the pattern in miniature, with expected short rates falling from 3.96% to 3.87% while its own term premium climbed from 0.21% to 0.24%.
The model does not extend to the 30-year, though the direction it captures across the curve is the one now visible at the long end: investors are charging less for the Federal Reserve and more for duration risk.
The term-premium model explains the direction of the move. Treasury’s own yield curves show where the repricing has actually landed. The department publishes a nominal par curve alongside a real par curve derived from Treasury Inflation-Protected Securities, and the two have moved almost in lockstep since January.
| 30-Year Treasury | 2 Jan 2026 | 17 Aug 2026 | Change |
|---|---|---|---|
| Nominal yield | 4.86% | 5.31% | +45bp |
| Real (TIPS) yield | 2.63% | 3.06% | +43bp |
| Implied inflation compensation | 2.23% | 2.25% | +2bp |
Source: US Department of the Treasury, daily par yield curve and daily par real yield curve.
Long-term market-implied inflation compensation, on that rough measure, has barely shifted, and the gap is not a clean read on expectations alone, since it also carries inflation-risk and liquidity premiums.
What the comparison does establish is that almost the entire 2026 move in long-dated Treasury bonds belongs to real yields and risk compensation rather than to the market’s view of future price levels.
That leaves the harder question. Why are investors demanding more real compensation to hold long-duration Treasuries?
The fiscal backdrop adds one source of pressure. Treasury expects to borrow $739 billion in privately held net marketable debt during the July to September quarter, $68 billion above its May projection, with another $628 billion pencilled in for October to December.
The Congressional Budget Office now expects a $2.1 trillion fiscal 2026 deficit, $200 billion above its February estimate, mostly on weaker tariff receipts.
The interest line is the more telling number. Net interest on the public debt reached $963 billion over the first 10 months of the fiscal year, up $117 billion or 14% year on year. CBO attributes the increase to a larger debt stock and higher long-term interest rates, with declines in short-term rates partially offsetting. The federal budget, in other words, is already recording the same curve split the bond market is pricing.
Supply itself has not yet been the trigger. August’s quarterly refunding held nominal coupon auction sizes flat at $58 billion of three-year notes, $42 billion of 10-year notes and $25 billion of 30-year bonds, with Treasury signalling no increase for several more quarters.
Demand at the 13 August sale held up, clearing at 5.216% on a bid-to-cover of 2.39 with a fractional tail. Buyers are turning up and pricing the paper at a quarter-century high.
The divergence already reaches beyond the bond market, because softer Fed hike odds are not translating into cheaper long-term borrowing. The 30-year fixed mortgage averaged 6.67% on 13 August and takes its cue from the long end rather than the federal funds rate.
The July FOMC minutes arrive on Wednesday, 19 August, and will show how close the three dissenters came to swaying the committee. A hawkish reading would lift the front end and flatten the curve, weakening the argument set out here. Should the two-year stay anchored while the 30-year Treasury yield holds above 5.2%, the split between policy expectations and duration risk becomes far harder to dismiss.
Sharper tests follow next month, with August CPI on 11 September and the FOMC decision on the 15th and 16th. Until then, the long bond is answering a question the Federal Reserve does not control: what is three decades of American fiscal risk worth?