Published on: 2026-08-17
Updated on: 2026-08-17
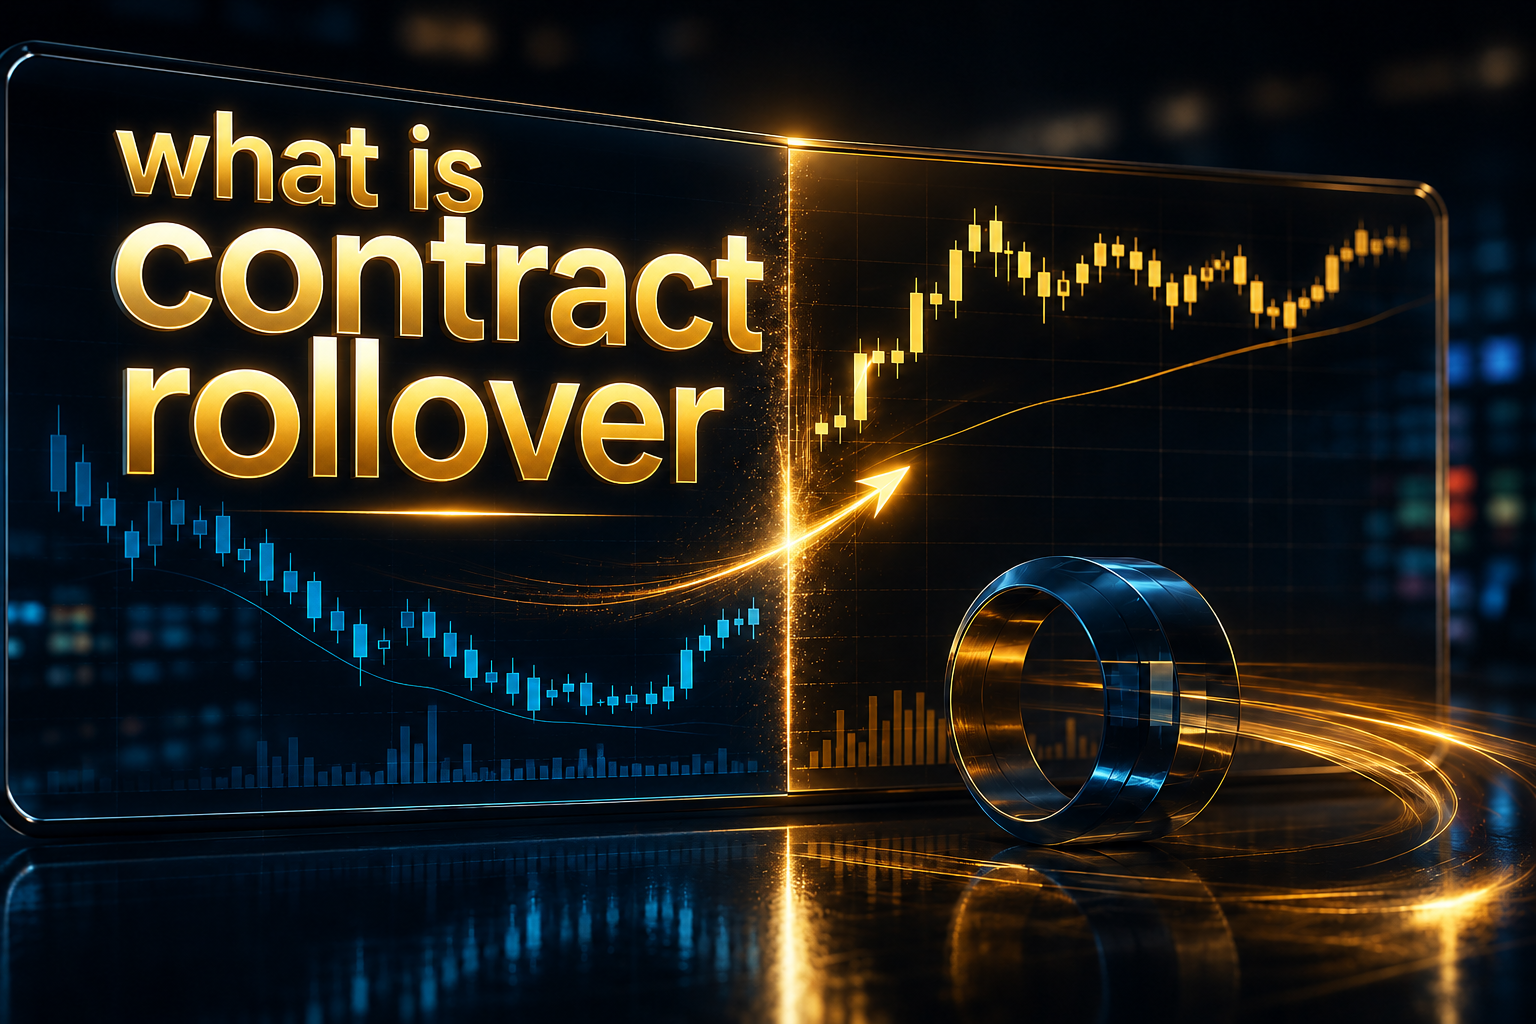
Contract rollover is the process of moving from a futures contract approaching expiry to a later-dated contract. Because the two contracts can trade at different prices, a continuous futures chart may show a sudden gap when it switches between them. The apparent jump can come from the contract change rather than an equivalent move in the underlying market.
Futures contracts expire, so trading activity eventually shifts to later-dated contracts.
The outgoing and incoming contracts can trade at different prices, creating a rollover gap on continuous charts.
Continuous futures charts join several expiring contracts into one longer price history.
Back-adjustment can remove visible rollover gaps by modifying earlier historical prices.
Check contract months and rollover dates before treating an unexplained chart gap as a breakout or market shock.
Futures contracts roll when each individual contract has an expiration date. As expiry approaches, market activity usually shifts toward a later-dated contract so participants can maintain exposure without holding the expiring contract.
Several contract months can trade at the same time, and each has its own price. The difference reflects factors affecting different delivery periods, including financing, storage and expectations for future supply and demand.
A trader rolling a position typically closes the expiring contract and opens a later one. A continuous futures chart performs a similar transition in its price series by replacing the outgoing contract with another contract. The rollover can affect the chart even when the market itself hasn't made a sudden move.
A rollover gap appears when the outgoing contract and incoming contract have different prices at the point where the chart switches between them. An oil futures series provides a simple example:
Contract |
Price |
Expiring contract |
$82 |
Next contract |
$84 |
Price difference |
$2 |
If the continuous chart ends the first contract at $82 and begins displaying the next at $84, the chart can appear to jump by $2. That $2 difference does not automatically mean oil suddenly rallied by $2. The next contract may already have been trading near $84 before it became the contract displayed on the continuous series.
A genuine market gap occurs when prices move sharply within the same contract. A rollover gap comes from joining two separate contracts that already trade at different levels. Checking the contract behind the chart therefore helps distinguish a real price move from a change in the data series.
Continuous futures charts solve one basic problem: no individual futures contract lasts forever. To create a longer historical chart, several contracts must be linked together.
A continuous futures chart combines successive contracts into one price history.
For example:
March → June → September → December
Instead of opening each expired contract separately, the chart presents the series as one continuous market history.
The chart still needs a rule for deciding when to stop using one contract and begin using another. Depending on how the series is constructed, that switch may occur before the outgoing contract officially expires.
A rollover gap appears when the new contract enters the continuous series at a different price from the contract it replaces.
If one contract ends at 4,800 and the incoming contract trades at 4,825, joining the two directly creates a 25-point jump.
The gap size depends on the price difference between the contracts. Some rollovers produce barely visible changes, while others can create much larger discontinuities. An unadjusted continuous chart leaves these differences visible.
Back-adjustment modifies historical prices to reduce or remove rollover gaps from a continuous chart. If the incoming contract trades $2 above the outgoing contract, earlier prices can be shifted so the transition appears smoother.
This produces a cleaner long-term series for studying trends, indicators and historical behaviour. The trade-off is that older adjusted values may no longer match the exact prices originally traded in those individual contracts.
A back-adjusted chart should therefore be treated as a constructed historical series rather than the price record of one contract that traded continuously over the entire period.
Yes. Rollover can change technical levels because indicators and chart patterns depend on the displayed price series.
A gap between contracts can alter the appearance of:
trendlines;
historical highs and lows;
price ranges;
technical indicators;
strategy backtests.
Back-adjustment can also shift historical prices, which may move previously identified levels on the chart.
For exact historical prices, the relevant individual futures contract provides the clearer reference. For longer-term market analysis, a continuous series is more practical, as long as you understand its rollover and adjustment method.
This also explains why an older chart screenshot may not perfectly match the same market viewed later using adjusted continuous data.
A few checks can usually show whether an unexplained move came from contract rollover.
Check the contract month. Confirm whether the chart displays a specific futures contract or a continuous series. A contract change near the gap is the first sign of rollover.
Compare the outgoing and incoming contracts. Open both contracts around the rollover period. If they were already trading at different prices before the switch, that difference can explain the gap.
Check the rollover date. Do not rely only on the official expiry date. A continuous series may switch to the next contract earlier as market activity moves toward the new contract.
Check whether the chart is back-adjusted. An unadjusted series may leave the rollover gap visible. A back-adjusted series can remove the gap while changing earlier historical price levels.
Compare the move within each contract. If the continuous chart jumps sharply while neither individual contract records the same move, the gap likely came from the switch between contracts.
These checks should come before treating an unexplained gap as a breakout, reversal or reaction to new information.
No. The gap size depends on the price difference between the outgoing and incoming contracts. Back-adjusted continuous charts can also reduce or remove the visible discontinuity.
Not always. Trading activity can move into the next contract before expiry, and continuous charts may switch contracts earlier, depending on the rollover method used for the series.
They may use different contracts, rollover dates or adjustment methods. One chart can preserve contract gaps while another adjusts historical prices to create a smoother continuous series.
Yes. Rollover gaps can trigger indicators, entries, or exits caused by the contract switch rather than normal price movement, so consistent historical data matters when testing futures strategies.
First, check a sudden jump on a futures chart against the contract behind the price series. If the chart has rolled into a differently priced contract, the gap may reflect how the historical data was joined rather than a sudden market change, and knowing that difference can prevent false breakouts, misplaced technical levels, and misleading conclusions from the chart.