Published on: 2026-04-27
The inverted yield curve has stopped flashing red, but that does not mean the warning has expired. After one of the longest Treasury curve inversions in modern market history, the harder question is whether normalization signals economic resilience, delayed recession risk, or a new phase of bond-market stress.
This is the point many investors miss. The end of an inversion is not the all-clear. It is the handoff from market warning to economic verification. A positive curve can reflect recovery, but it can also appear when traders expect Federal Reserve rate cuts, weaker growth, or higher long-term risk premiums.
As of April 24, 2026, the 10-year Treasury yield was 0.53 percentage points above the 2-year yield, while the 10-year yield was 0.62 percentage points above the 3-month Treasury rate. Both key curves had normalized, but the signal still required interpretation.
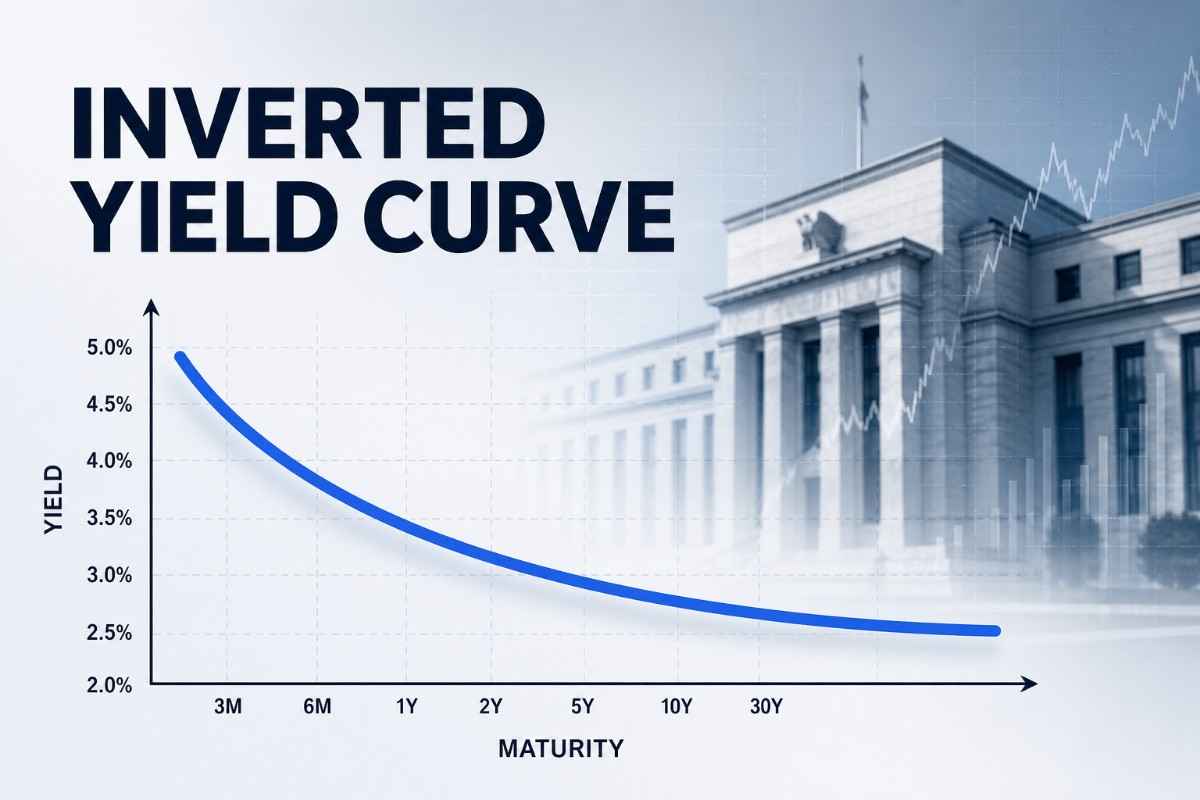
An inverted yield curve occurs when short-term Treasury yields rise above long-term yields.
It usually reflects restrictive monetary policy, slower growth expectations, and pricing for future rate cuts.
The 2-year/10-year spread is widely followed by markets, while the 10-year/3-month spread is often used in recession models.
The end of an inversion does not automatically remove recession risk.
The key question is why the curve is steepening: short-term yields falling, long-term yields rising, or growth expectations improving.

A normal yield curve slopes upward because investors usually demand higher yields for lending money over longer periods. Time creates uncertainty around inflation, growth, fiscal policy, and future interest rates.
An inverted yield curve reverses that pattern. Short-term debt pays more than long-term debt. In the U.S. Treasury market, the most-watched measures are the 2-year/10-year and 10-year/3-month spreads.
The signal matters because short-term yields are closely tied to Federal Reserve policy. Long-term yields reflect expectations for inflation, growth, Treasury supply, and demand for safe assets. When short-term yields rise above long-term yields, markets are effectively saying that policy is tight today and growth may weaken tomorrow.
The curve usually inverts when the Federal Reserve raises interest rates to control inflation. Short-term Treasury yields rise first because they track the expected path of policy rates.
Long-term yields may rise less, stall, or fall if investors believe tight policy will slow the economy. Demand for longer-term bonds can also increase when investors seek safety, pushing prices higher and yields lower.
That makes inversion a compressed macro signal. It combines restrictive policy, weaker future growth expectations, and demand for long-duration safety into a single market price.
The timing is where many readers get trapped. Higher rates do not hit the economy all at once. They first pressure housing, bank lending, refinancing, and business investment. Only later do they show up in hiring, earnings, defaults, and consumer spending. The curve can therefore look wrong for months before its message becomes visible in the real economy.

Image Source: Advisor Perspectives
The recent inversion caused unusual confusion because the recession did not arrive on the traditional timetable. The 10-year minus 2-year spread was continuously negative from July 5, 2022, to August 26, 2024, and the 10-year minus 3-month spread stayed negative from October 25, 2022, to December 12, 2024.
That long warning period collided with a resilient economy. Strong nominal wage growth, steady hiring, fiscal support, post-pandemic household buffers, and earlier corporate refinancing helped delay the effect of higher rates. The curve did not become useless. The transmission mechanism became slower.
This distinction is essential. The yield curve does not predict the exact month of recession. It signals that monetary policy has become restrictive relative to expected future growth. In this cycle, that pressure built beneath the surface while headline data stayed stronger than expected.
The inverted yield curve has earned its reputation because inversions have preceded each of the last eight U.S. recessions, while late 1966 and late 1998 stand out as notable false positives.
The Cleveland Fed’s model uses the spread between short-term and long-term rates to estimate future GDP growth and recession probabilities, while warning that yield-curve signals should be interpreted with caution.
The economic logic is straightforward. High short-term rates make credit more expensive. Banks have less incentive to borrow short and lend long. Companies delay investment. Consumers feel pressure from mortgages, credit cards, auto loans, and floating-rate debt.
But the curve is not a countdown clock. It is a pressure gauge. It shows that financial stress is building, but it does not reveal exactly where the economy will break.
That is why the post-inversion phase matters. If labor and credit data weaken after the curve normalizes, the end of inversion may mark the transition from warning to confirmation.
The end of an inverted yield curve is often misread as automatically bullish. It is not. A positive curve can emerge from very different market forces.
| Type of Steepening | What Changes | Market Signal |
|---|---|---|
| Bull steepening | Short-term yields fall faster than long-term yields | Markets expect Fed cuts and slower growth |
| Bear steepening | Long-term yields rise faster than short-term yields | Markets price inflation, fiscal risk, or higher term premium |
| Recovery steepening | Policy pressure eases while growth expectations improve | More constructive for risk assets and bank margins |
A bull steepening can look encouraging because the inversion ends, but it often reflects rate-cut expectations. That may support bonds, yet it can also mean markets see weaker growth ahead.
A bear steepening is more uncomfortable. It happens when long-term yields rise because investors demand more compensation for inflation, Treasury supply, or fiscal risk. This can pressure equities, housing, and long-duration assets even if recession fears ease.
A recovery steepening is the cleanest outcome. It suggests policy is becoming less restrictive while growth expectations remain firm. That is usually more supportive for banks, cyclicals, and broader risk appetite.
The same curve shape can therefore tell three different stories. The driver matters more than the direction.
As of April 24, 2026, the most-watched Treasury curve measures were no longer inverted. The 10-year Treasury yield finished at 4.31%, the 2-year yield at 3.78%, and the 30-year yield at 4.91%.
| Indicator | Latest Reading | Market Signal |
|---|---|---|
| 10Y–2Y Treasury spread | +53 bps | Front-end recession stress has eased, but policy lags still matter |
| 10Y–3M Treasury spread | +62 bps | A key recession-model curve has normalized |
| 3-month Treasury bill rate | 3.70% | Near-term policy pressure remains restrictive |
| 10-year Treasury yield | 4.31% | Long-end rates still reflect inflation, supply, and term-premium risk |
| 30-year Treasury yield | 4.91% | Long-duration borrowing costs remain elevated |
The current setup looks less like a clean victory lap and more like a mixed normalization. Short-term yields have moved below long-term yields, reducing the immediate recession signal. Yet long-term borrowing costs remain high enough to keep pressure on mortgages, corporate financing, and equity valuations.
The Cleveland Fed’s April 2026 model showed a 3-month Treasury bill rate of 3.70%, a 10-year Treasury rate of 4.33%, a positive curve slope of 63 basis points, projected GDP growth of 3.5%, and a one-year recession probability of 14.5%. That points to moderated recession risk, not a full disappearance of risk.
The yield curve gives the macro warning. Credit and labor data decide whether the warning becomes reality.
| Indicator to Watch | Why It Matters |
|---|---|
| Initial jobless claims | Early signal of labor-market cooling |
| Credit spreads | Shows whether investors demand more compensation for default risk |
| Bank lending standards | Measures whether credit is becoming harder to access |
| Earnings revisions | Reveals whether companies are cutting profit expectations |
| Consumer delinquencies | Tracks stress in household balance sheets |
| Fed rate-cut pricing | Shows whether markets expect relief or recession insurance |
If the curve steepens while hiring remains firm, credit spreads stay contained, and earnings estimates stabilize, normalization looks more like a soft-landing signal.
If the curve steepens because short-term yields fall sharply while unemployment rises and credit spreads widen, the message becomes defensive. In that scenario, the end of inversion would not mean the cycle has healed. It would mean markets have moved from pricing policy stress to pricing economic damage.
The inverted yield curve remains one of the clearest market signals of policy stress and growth uncertainty. But the end of an inversion does not mark the end of the analysis. It begins the next phase.
A positive curve can reflect recovery, rate-cut expectations, or rising long-term risk premiums. Investors should focus on the driver of steepening, the condition of credit markets, and the resilience of labour demand. The curve does not predict the future alone, but it shows where financial pressure is building and where the next macro turning point may emerge.