XLF can hold its record ground as long as trading, underwriting, and advisory income stay elevated, because those businesses produced the earnings surprise behind the move.
The State Street Financial Select Sector SPDR ETF gained about 6.2% in July while the S&P 500 slipped roughly 0.1%, making financials the second-best performing sector of the month. The fund closed Friday, July 31 at $56.94, just over 1% below the record close of $57.60 set on July 28.

The rally arrived late. As recently as July 10, the fund’s year-to-date total return stood at 2.6%, so much of the re-rating rests on a single quarter of earnings.
XLF gained about 6.2% in July 2026, closing at a record $57.60 on July 28, the second-best S&P 500 sector for the month.
Trading and dealmaking, not loan growth, produced the second-quarter earnings surprise across the largest US banks.
Banks account for only 28.50% of the fund, and payments, insurance and capital markets names led July's advance.
The rally holds if deal backlogs convert and payment volumes stay firm, and weakens if trading revenue normalizes.
The path to July’s high was not smooth. XLF cleared its previous closing high of $56.75 from July 16 during trading on July 27, then reached $57.60 intraday on July 28 and closed there, having fallen more than 15% from its January highs by the end of March as geopolitical tensions pressured markets.
Recovering that ground inside four months means the sector was re-rated quickly rather than accumulated steadily, and rapid re-ratings require earnings confirmation.
State Street put the fund at 16.09 times forecast one-year earnings as of July 30, which does not look stretched against the broader market. Whether the revenue lines behind the confirmation are repeatable is the open question.
Second-quarter results from the largest US banks were driven overwhelmingly by fee and trading businesses. Goldman Sachs reported net revenues of $20.34 billion, up 39% year over year, with investment banking fees of $3.40 billion (up 55%), equities revenue of $7.42 billion (up 72%), and FICC revenue of $4.59 billion (up 32%).
JPMorgan Chase reported a 41% increase in net income, although much of that headline gain came from a $4.6 billion Visa-related gain and about $1.0 billion of other equity-investment gains; excluding significant items, net income rose 13%. Citigroup delivered a 45% jump in quarterly profit alongside its highest quarterly revenue in a decade.
The breadth of the trading result was striking. Equities trading revenues rose 86% at JPMorgan, 72% at Goldman Sachs, 70% at Bank of America, 69% at Morgan Stanley, and 45% at Citigroup, against a 2025 base that was already historically strong. Investment banking fees climbed 30% at JPMorgan, 50% at Bank of America, and 35% at Wells Fargo, while Citigroup’s investment banking revenues, a broader measure, rose 44%.
Industry-wide, global investment banking revenue reached $61.4 billion in the first half of 2026, up 24% from a year earlier, according to Dealogic, helped by the roughly $86 billion SpaceX IPO and its estimated $500 million fee pool.
At the capital-markets-heavy banks, net interest income was a supporting act rather than the headline, though it kept growing across the sector, rising 5% at Wells Fargo. The easy gains from higher rates were already behind the sector entering 2026, which is precisely why the fee lines produced the surprise.
The rally’s leaders sat outside the banking book. PayPal rallied roughly 30% over the month to lead the fund, and Coinbase, Block, FactSet, and Fidelity National Information Services each gained 4% or more on the day of the record. Banks account for only 28.50% of XLF, against 28.20% in financial services, 25.46% in capital markets, 13.65% in insurance and 4.18% in consumer finance.
That composition is how the fund set a record without a lending boom. As of July 30, XLF held 76 positions and $57.61 billion in assets, with the top ten at 56.79%.
| Major XLF holding | Weight | Primary earnings exposure | Recent earnings |
|---|---|---|---|
| JPMorgan Chase | 11.68% | Lending, deposits, trading, investment banking | Q2 2026: Net income reached $21.2B, or $16.9B excluding significant items. Markets revenue rose 35% and investment-banking fees increased 30%. |
| Berkshire Hathaway | 11.61% | Insurance and diversified operating businesses | Q1 2026: Operating earnings rose to $11.35B from $9.64B, led partly by stronger insurance underwriting. Q2 results had not yet been released. |
| Visa | 7.55% | Payment volumes and transaction fees | Fiscal Q3 2026: Net revenue rose 14% to $11.63B, while adjusted EPS reached $3.32. Payment volume and processed transactions increased 10%. |
| Mastercard | 5.79% | Payment volumes and transaction fees | Q2 2026: Net revenue rose 14% to $9.28B, while adjusted EPS reached $5.04. Switched transactions increased 9%. |
| Bank of America | 5.01% | Lending, deposits, markets, investment banking | Q2 2026: Net income rose 27% to $9.1B and revenue increased 15% to $31.6B. Investment-banking fees climbed 50%. |
The 2-year and 10-year spread turned positive again in April, which improves lending economics at the money-center banks while leaving the payment networks untouched.
The move coincided with money leaving high-flying technology names, and a 0.08% expense ratio and heavy daily volume make XLF the default vehicle for short-term positioning in financials. That is why a rotation of this size showed up in the price so quickly.
Four conditions would extend the move.
The first is deal conversion. Goldman Sachs reported that its investment banking fees backlog increased against both the first quarter and the end of 2025, and CEO David Solomon told analysts the firm’s deals backlog stood at a five-year high. Backlogs generate no revenue until transactions close, so the conversion rate over the next two quarters is the tell.
The second is a continued underwriting calendar; Morningstar expects investment banking revenues to finish 2026 as the second-strongest calendar year on record, trailing only 2021. The third is payment volume resilience, which ties Visa and Mastercard to consumer spending rather than credit conditions.
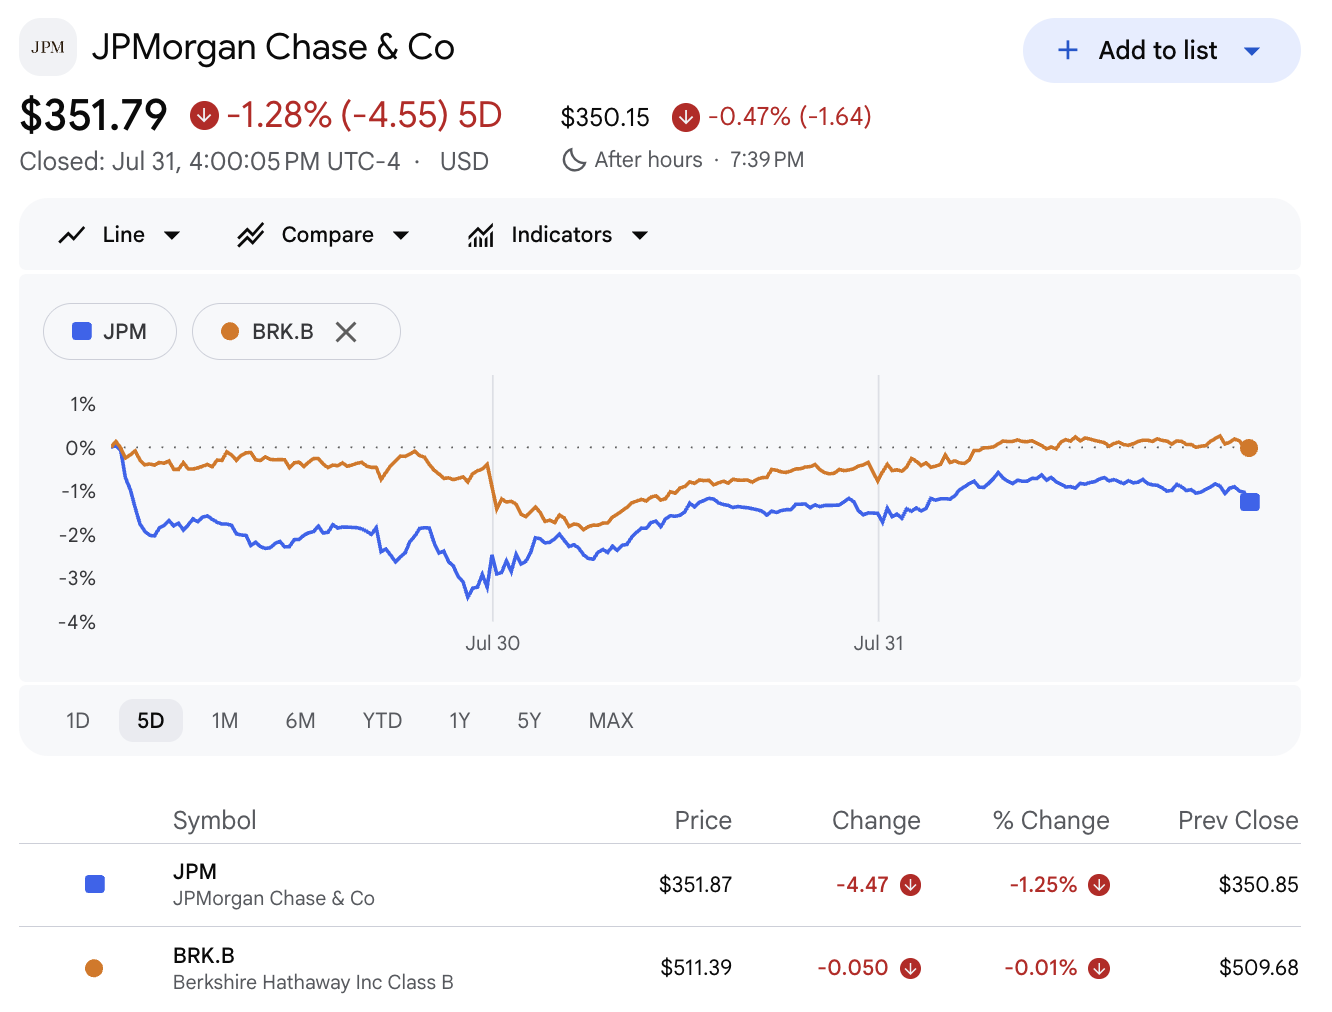
The fourth is Berkshire Hathaway, which reports second-quarter results in early August, its first summer report under Greg Abel, with the stock trailing the S&P 500 by roughly seven percentage points this year. At an 11.61% weight, Berkshire moves XLF almost as much as JPMorgan, the largest holding at 11.68%.
Trading revenue is the least predictable line in the sector. The current strength reflects geopolitical conflict, rapid technological change, and index levels near record highs, a combination unlikely to hold through an entire cycle. A quarter of normalized trading revenue would remove a meaningful share of the earnings that justified the July move.
Rates are the second pressure point, and the risk has flipped direction. The Federal Reserve held its target range at 3.50% to 3.75% on July 29, with three policymakers voting for a quarter-point increase, and inflation remains above target.
Higher-for-longer can lift asset yields, but the net effect on margins depends on deposit betas and loan repricing, and a hold paired with a firmer dot plot would tighten conditions without changing the headline rate.
Credit is the third. Private credit assets now exceed $2 trillion, and redemption requests at several semi-liquid funds exceeded their quarterly caps in early 2026. Alternative asset managers and the banks that finance them both sit inside XLF, so stress there reaches the fund twice.
The evidence to track over the next two reporting seasons: whether announced mergers close, whether underwriting volumes hold, whether trading revenue settles above the 2025 base rather than reverting to it, and whether credit provisions stay contained.
Strength in three of those four would support the current valuation. Deterioration in trading alongside flat loan growth would leave the July high looking like a rotation peak rather than an earnings-backed breakout.
XLF has returned about 10.4% including dividends over the past twelve months, which still trails what the July headlines suggest. The record was earned by revenue streams that are diverse and cyclical at the same time. Sustaining it depends less on the Federal Reserve than on whether Wall Street’s deal pipeline keeps clearing.