The S&P 500 fell roughly 0.13% in July because index weight decides the outcome, not company count, even as a market tally taken before the final two sessions showed 296 constituents, or 59%, higher for the month.
Price action was consistent with rotation between sectors rather than broad liquidation, with financials ranking second behind energy while XLF gained about 6.2% and reached a record high. Strong trading, underwriting and advisory results at major banks supported the move, alongside gains across payments, insurance and other financial businesses.
As of Monday, August 3, that rotation already faces an early test. Crude fell about 6% after the US called off planned strikes on Iran, undercutting the oil strength behind energy's July lead, while US equity futures pointed higher ahead of a heavy earnings week and Friday's July jobs report.

The S&P 500 closed July at 7,489.72 against 7,499.36 on June 30, a price decline of roughly 0.13%, or about 0.1% rounded.
A market tally taken before the final two sessions showed 296 constituents, or 59%, higher for the month. That count has not been confirmed against July 31 closing prices.
The index weights holdings by float-adjusted market value, so index impact equals weight multiplied by price move rather than one vote per company.
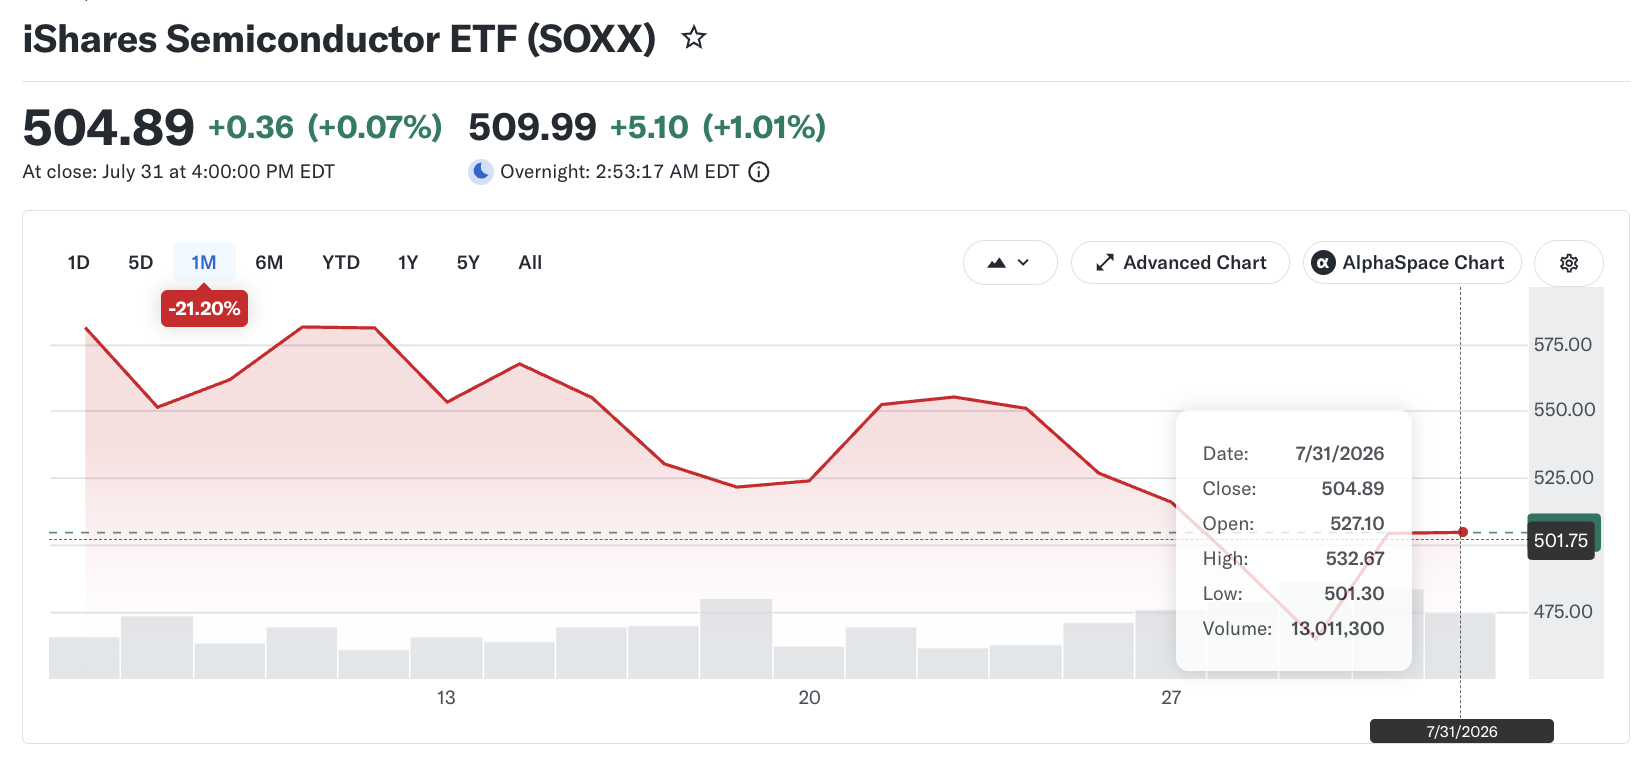
The semiconductor complex supplied the clearest drag, with the iShares Semiconductor ETF down 22.1%, its worst month since December 2002.
The equal-weight S&P 500 ETF rose approximately 1.1% while the cap-weighted index fell, indicating the average constituent held up better than the benchmark.
The decline was small in size and large in significance. It was the first negative July for the S&P 500 since 2014, ending eleven consecutive positive Julys from 2015 through 2025, a streak set out in EBC’s S&P 500 returns July 2026 preview. It was also the second straight monthly loss, following June’s 1.1% pullback.
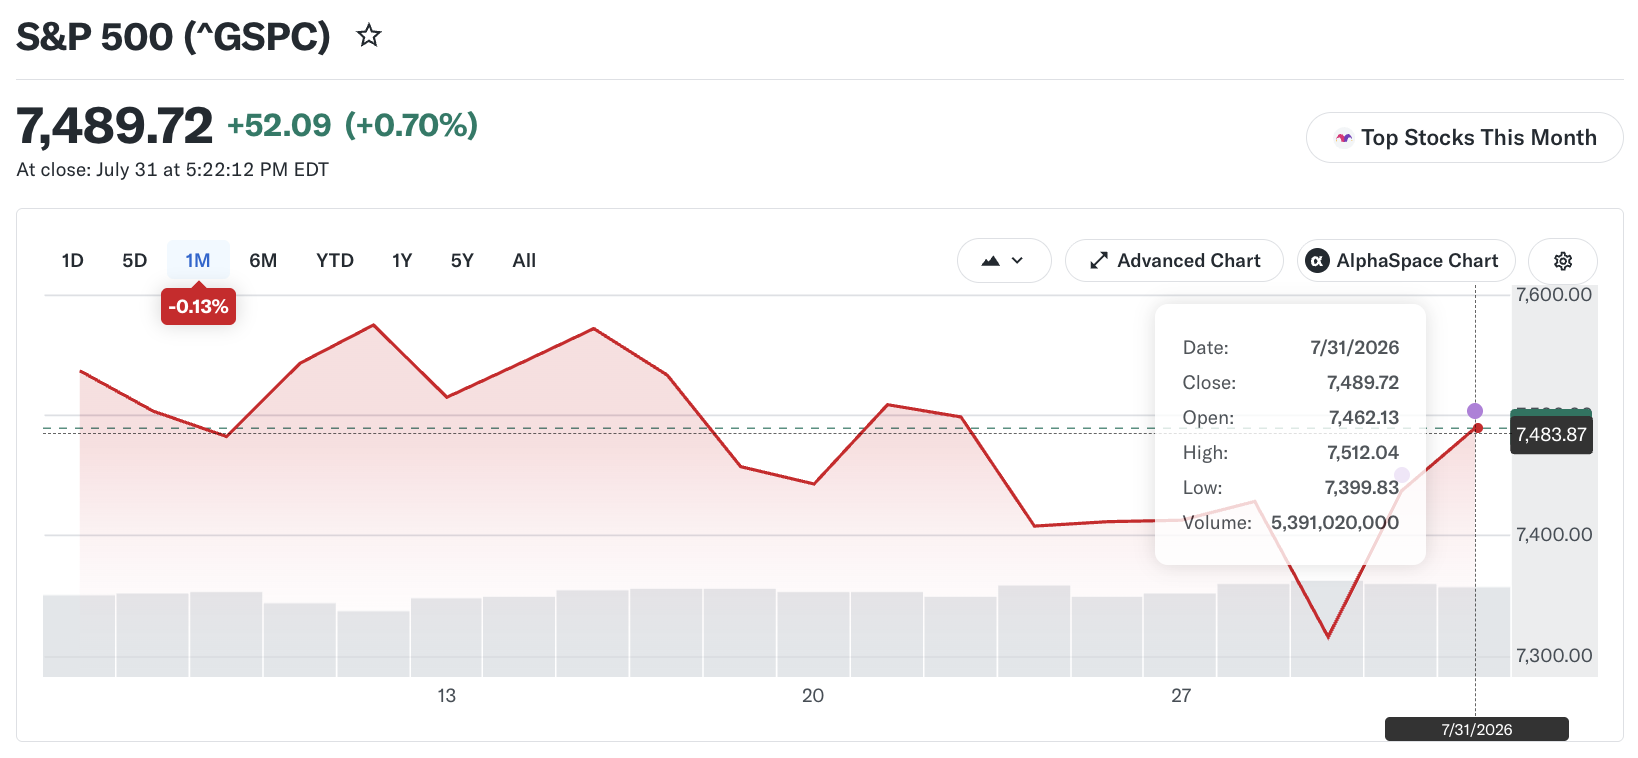
The final session did most of the repair work. The index closed July 30 at 7,437.63, about 0.8% below its June 30 level, then rose 0.7% on July 31 to finish at 7,489.72. Any monthly figure published before that close overstates the decline.
| Measure | Value |
|---|---|
| Close, June 30 | 7,499.36 |
| Close, July 30 | 7,437.63 |
| Close, July 31 | 7,489.72 |
| July 31 session change | +0.70% |
| Month through July 30 | −0.82% |
| July price return | −0.13% |
| June price return | −1.06% |
S&P Dow Jones Indices weights its US benchmarks by float-adjusted market capitalization, which excludes strategic and closely held shares. Breadth counts companies, while the headline index counts dollars of tradable market value.
The arithmetic is unforgiving. A 5% decline in a stock weighted at 6% subtracts about 0.30 percentage points from the index, while a 10% gain in a stock weighted at 0.05% adds about 0.005 percentage points.
Sixty of the smaller advances would be needed to neutralize that single large decline, illustrating the type of imbalance capable of producing July’s result. Confirming the exact contribution pattern would require a constituent-level analysis using each company’s opening weight and monthly return.
The effect is not confined to full months. EBC’s account of the June 9 intraday reversal documents a single session in which close to three quarters of constituents rose while the index swung to a 2.3% intraday loss, with semiconductors again the pressure point. For the underlying definitions, EBC’s market breadth guide covers advancing and declining counts in detail.
Information technology carried roughly 36% of S&P 500 weight at the end of July, and the pressure inside that block was concentrated rather than general. The iShares Semiconductor ETF fell 22.1% for the month even after a 9% surge across the final two sessions, its worst month since a 23.3% decline in December 2002, according to analyst data. The fund still held a 67.7% gain for 2026.
The broader technology sector tracked by the State Street Select Sector SPDR Fund fell about 8%, a slide deepened by a 7.4% drop in Apple shares on the final session. Micron Technology finished the month down 28.7%.
Software and several mega-caps moved the other way, which is why the drag was narrower than a sector-level headline suggests. The iShares Expanded Tech-Software Sector ETF gained 4.4%, lifted largely by Microsoft, whose shares climbed 24.6% after a strong quarterly report, and Amazon rallied on the final session.
The memory, equipment and components names still fell far enough, and carried enough combined weight, to set the monthly outcome.
The month’s extremes were unusually wide. Sandisk fell 46.6% in July yet remained the index’s best 2026 performer with a 411.8% gain. Corning declined about 46% and KLA lost roughly 39%. On the other side, Cognizant Technology rose about 43%, with Accenture up 33% and PayPal Holdings up 32%.
These names illustrate dispersion rather than causation. Index impact equals weight multiplied by percentage move, so a 45% decline in a mid-sized constituent can register less on the benchmark than a 5% decline in one of its largest members.
Sandisk and Corning showed how severe individual losses became in parts of the market, while the combined weight of the chip and hardware complex carried the greater index-level effect. The same caution applies in reverse. Cognizant and PayPal confirm that specific earnings stories were exceptionally strong, without proving that the aggregate market was strong.
The price action was more consistent with sector rotation than with broad equity liquidation. Financials ranked second behind energy, which led all sectors as oil prices remained elevated, and the 6.2% advance in the financials ETF rested on trading, underwriting and advisory revenue rather than loan growth. Technology supplied the clearest drag.
The equal-weight measure corroborates that reading. The Invesco S&P 500 Equal Weight ETF rose approximately 1.1% in July while the cap-weighted index fell about 0.1%, a gap consistent with a decline driven by a small number of heavily weighted names. If you are comparing the two structures as portfolio positions rather than as diagnostics, you can visit EBC’s RSP vs SPY analysis.
The macro backdrop supported the reshuffling. The Federal Reserve left its target range unchanged at 3.50% to 3.75% on July 29, and long-dated yields pushed higher, with the 30-year Treasury reaching about 5.27%, its highest level since 2007, and the 10-year around 4.74%. Higher discount rates weigh most heavily on long-duration growth valuations.
July also inverted the setup EBC documented in March, when the index held up while participation narrowed, an episode covered in S&P 500 hidden correction. This time the benchmark softened while the typical constituent held firm.
The constructive reading is straightforward. A majority of constituents rising while the index falls suggests weakness stayed contained within one part of the market, and broader participation reduces dependence on a small group of mega-caps.
The cautious reading is equally valid. With technology holding roughly 36% of index weight, improved breadth elsewhere cannot reliably prevent further headline losses when the largest holdings decline, and a rising advancer count says nothing about the earnings quality or valuation of the companies advancing.
The balanced conclusion is that July showed better participation beneath the index alongside greater vulnerability at the top of it.
Four markers will show whether July’s pattern persists. The first is whether semiconductors stabilize, given that the sector both caused the monthly decline and retains a large 2026 gain that could still be given back. The second is whether the equal-weight benchmark continues to outpace the cap-weighted index, which is the cleanest ongoing read on participation.
The third is sector leadership, specifically whether financials and energy hold their July advantage or hand it back to technology. The fourth is the path of long-dated yields, which price long-duration growth assets directly and were rising into month-end.
The practical lesson is definitional rather than tactical. The headline S&P 500 measures the performance of US large-company market value. It was never designed to report how the typical stock behaved, and July made the gap between those two ideas unusually easy to see.
If you are ready to act on where index leadership goes next, the S&P 500 is available as an index CFD at EBC Financial Group, alongside share, ETF and commodity markets on the same platform. Open a live account to get started.