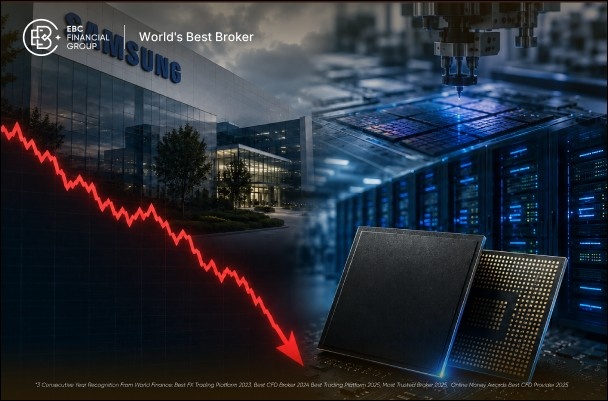
DRAM carried more than $20 billion of assets through the late-July selloff after losing 32% during the month. Samsung, SK hynix and Micron controlled nearly three-quarters of the fund and declined together, overwhelming the effect of record share creations. The ETF stayed enormous while the memory trade underneath it reversed.
DRAM reached $10 billion in 50 days, with much of its growth arriving after memory stocks had already recorded substantial gains.
Samsung, SK hynix and Micron tie most of the fund to the same memory pricing and AI spending cycle.
Approximately $8.8 billion entered during the drawdown, offsetting part of the decline in total fund assets.
SOXX and SMH fell less because they spread exposure across processors, foundries, equipment and other semiconductor businesses.
A durable recovery depends on HBM pricing and further earnings upgrades, not another surge in ETF creations.
DRAM grew rapidly because it offered a direct US-listed route into Samsung, SK hynix and the surge in high-bandwidth memory demand. Roundhill launched the fund on April 2 as a focused portfolio of global memory and storage companies, including producers of HBM, DRAM, NAND and enterprise storage.
The fund reached $10 billion in about 50 days, breaking the previous speed record for an ETF crossing that threshold. Net inflows later exceeded $21 billion as assets approached $26 billion by the end of June.
AI infrastructure spending had tightened supplies while memory-company revenue and margins accelerated. DRAM put the global memory trade into one accessible ticker after the underlying stocks had already recorded substantial gains. The same timing that accelerated the fund’s growth also left new capital exposed to elevated expectations.
Micron, Samsung and SK hynix represented 74.8% of DRAM at the end of June. Their operations differ, but their profits respond to many of the same forces, including memory prices, HBM capacity, inventories and AI infrastructure spending.
Several tickers therefore mask one dominant memory cycle. When valuations fell in July, DRAM had few holdings outside that cycle capable of offsetting the decline.
DRAM placed almost three times as much weight in its three largest holdings as SOXX.
| Fund | Main exposure | Top-three weight | June 22 to July 17 decline |
|---|---|---|---|
| DRAM | Memory, HBM, NAND and storage | 74.8% | Nearly 40% |
| SOXX | Broad semiconductor industry | About 25.1% | About 24% |
| SMH | Large global semiconductor companies | About 37.9% | About 20% |
SOXX spreads more capital across processors, analog chips, networking semiconductors and manufacturing equipment. SMH is also concentrated, but its leading positions span chip design, foundry production and connectivity. DRAM has fewer businesses capable of offsetting a memory selloff.
Holdings weights reflect reported data available near the end of June and July. All three drawdowns use the same June 22 to July 17 period reported by ETF.com.
DRAM could receive $8.8 billion of net inflows and still fall because new ETF shares did not prevent its underlying memory stocks from losing value. The 32% figure in the headline measures DRAM’s calendar-month decline in July, while the nearly 40% drawdown runs from its June 22 peak to the July 17 low. Over that peak-to-trough period, DRAM dropped from $80.72 to $48.64.
A 40% market loss would reduce a $25.9 billion fund to roughly $15.5 billion. Adding $8.8 billion of net creations would lift total assets back toward $24.3 billion.
The actual fund still held approximately $23.4 billion on July 17, only moderately below its late-June peak despite the collapse in its share price. The inflows offset much of the lost asset value without reversing the loss on each share.
New creations kept the fund large. They did not stop each existing share from losing value.
DRAM fell because record memory earnings were already embedded in share prices. Micron’s fiscal third-quarter revenue reached $41.46 billion, up from $9.30 billion one year earlier.
SK hynix reported 257% annual revenue growth and a 76% operating margin in the second quarter. The company attributed the performance to higher memory prices and increased sales of HBM, AI-server DRAM and enterprise SSDs.
Samsung’s memory business also delivered record quarterly revenue and operating profit as server products, HBM4 shipments and industry-wide price increases supported results.
Those numbers confirmed that the memory boom remained intact. DRAM had already gained 191% at its June peak, leaving share prices dependent on results that could continue exceeding an increasingly demanding market bar.
Attention shifted to whether AI spending could remain this strong, how quickly memory capacity would expand and whether DRAM and NAND prices could keep rising. Record results had become the minimum expected. Strong earnings did not fail. Expectations outran them.
Samsung Electronics, Micron Technology and SK hynix dominate DRAM. Other holdings include Sandisk, Kioxia, Western Digital, Seagate, GigaDevice, Nanya and Winbond. The portfolio can obtain part of its company exposure through total-return swaps rather than direct shares.
Roundhill uses total-return swaps to meet regulated investment company diversification requirements while maintaining exposure to its largest memory holdings. Treasury bills and money-market instruments sit alongside those derivatives as liquid assets, so they should not be mistaken for a large defensive position against memory stocks.
No. DRAM itself does not target a multiple of its daily performance. RAM seeks 200% of DRAM’s daily return, while RAMZ seeks negative 200%. Both reset after each session, so their multi-day returns can differ sharply from a simple two-times calculation.
Yes. DRAM can decline if HBM order growth slows, production expands faster than demand, contract prices peak or earnings estimates begin falling. Strong current profits offer limited protection when memory-stock prices already assume continued supply constraints and further earnings growth.
ETF inflows create additional shares and increase total fund assets, but they do not guarantee gains in the underlying stocks. DRAM received about $8.8 billion during the drawdown while Samsung, SK hynix, Micron and other holdings continued falling. The new money offset part of the asset decline without protecting each share’s value.
Sandisk’s August 5 results and August 13 investor day are the next scheduled tests for NAND pricing, data-centre demand and forward guidance. They will provide an early reading on the memory cycle, although the broader direction remains tied to Samsung, SK hynix and Micron.
HBM shipments, server DRAM prices and company earnings forecasts will determine whether July marked a temporary valuation reset or the start of a deeper reassessment. Strong demand alone will not restore DRAM’s June valuation.
A durable recovery requires earnings upgrades to exceed what memory-stock prices already discount, not another billion dollars entering the fund.